Business Vision and Strategy
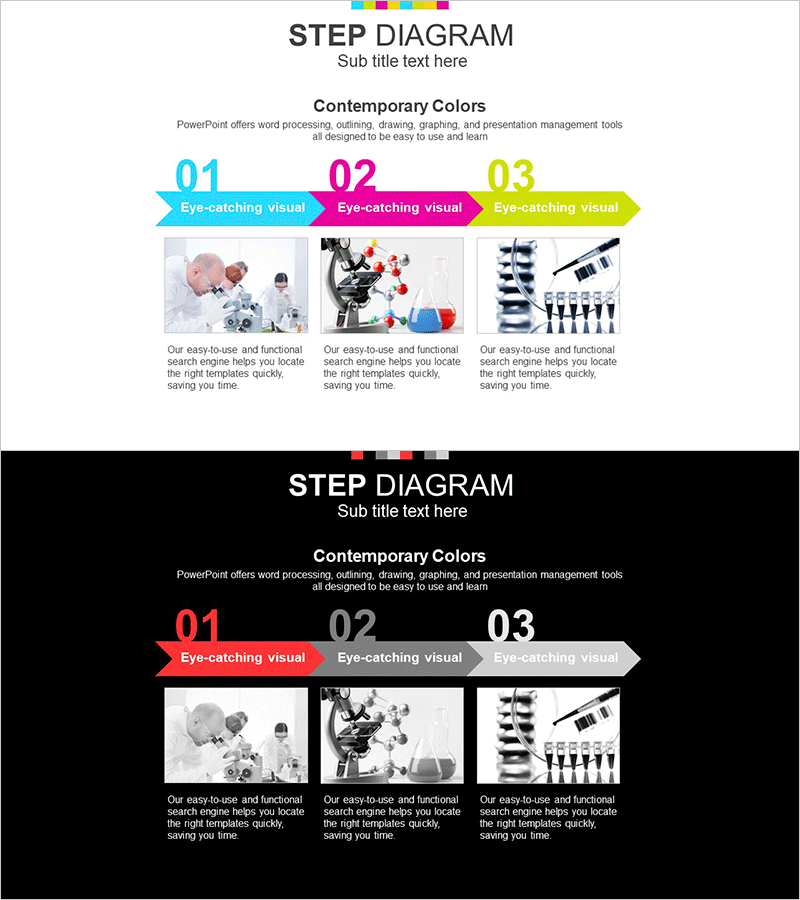
Science Experiment Research Goals Diagram – Visualizing with Linear Flow
RJ0700008_28
- Last Update 12/21/2025
- File Size 1.9MB
- # of Slides 2
- File Format PPTX
- Slide Ratio 16:9
- Color
Keywords
About the Product
This slide visualizes the research goals of a science experiment in a linear flow diagram, clearly expressing the stages of development and objectives. With a modern and clean design in black and white, it is suitable for various presentation environments, especially in educational or research-related contexts. Optimized for visually highlighting goal setting and planning, this template effectively communicates the core objectives at each stage to enhance audience understanding.
Related Products
-
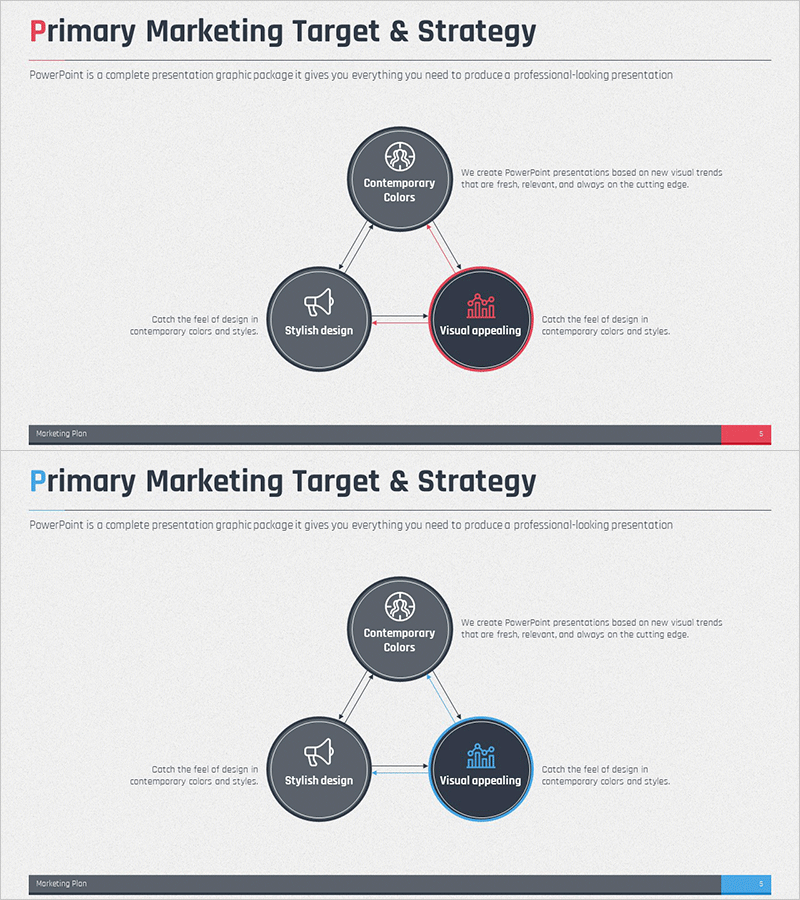
Marketing Target & Strategy Cycle Diagram – Clarifying Goals and Strategic Approach
#Marketing Plan and Strategy #Diagram #Marketing Strategy
-
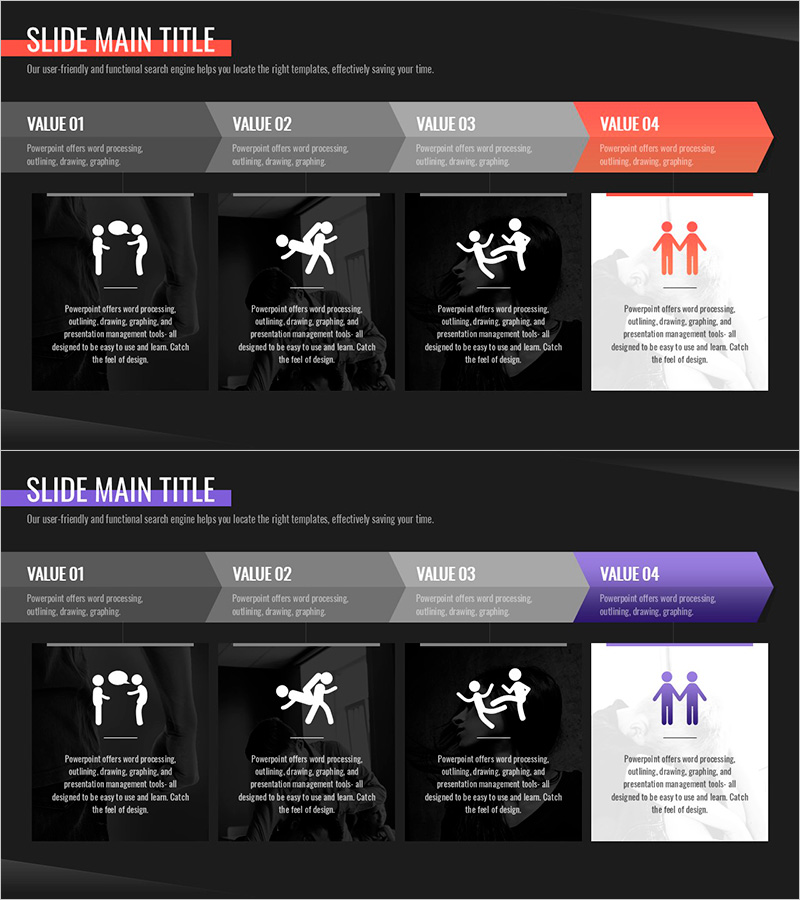
Communication System Diagram – Effective Information Delivery
#Business Management #Operation Plan #Diagram
-
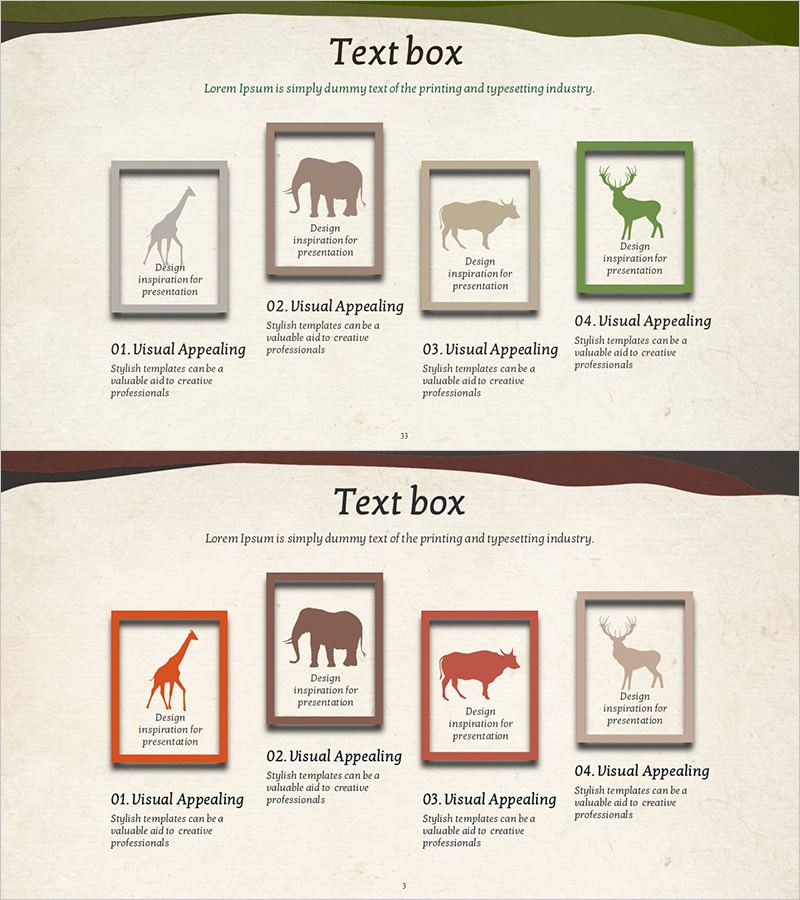
Animal Nature Conservation Program Future Plan Roadmap
#Product/Service #Diagram #Product/Service Introduction
-
Donut Chart by Lighting Sales Rankings – Market Data Analysis
#Market and Competitor Analysis #Financial Plans and Performance #Diagram
