Financial Plans and Performance
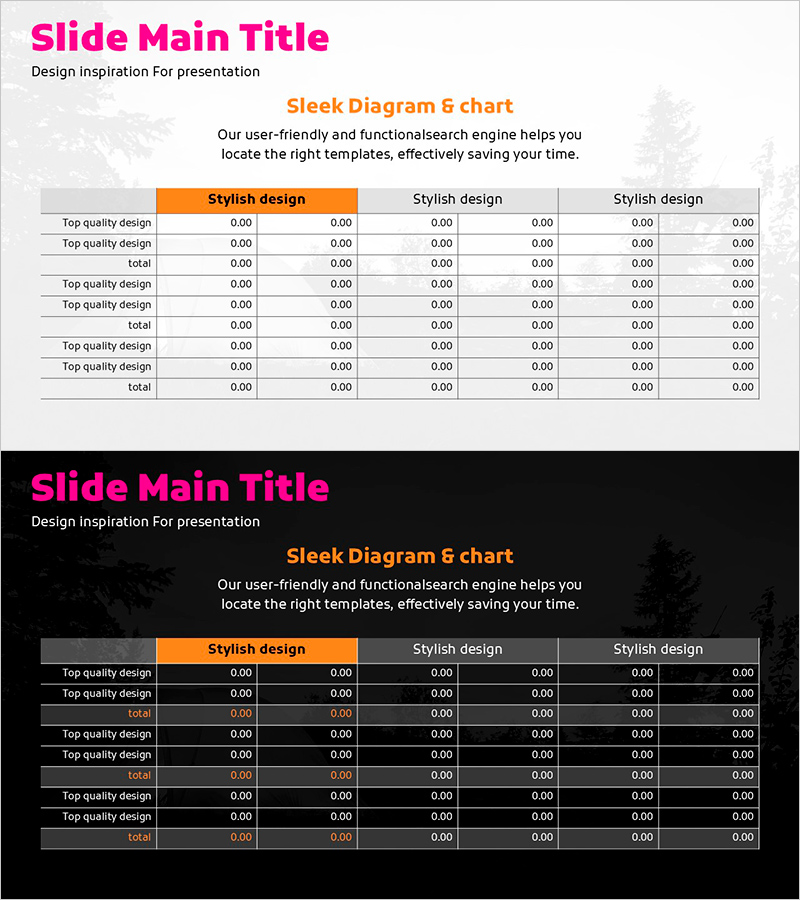
Effectively Present Financial Performance with Table Charts in Forest Background
RJ0600094_12
- Last Update 12/21/2025
- File Size 1.4MB
- # of Slides 2
- File Format PPTX
- Slide Ratio 16:9
- Color
Keywords
About the Product
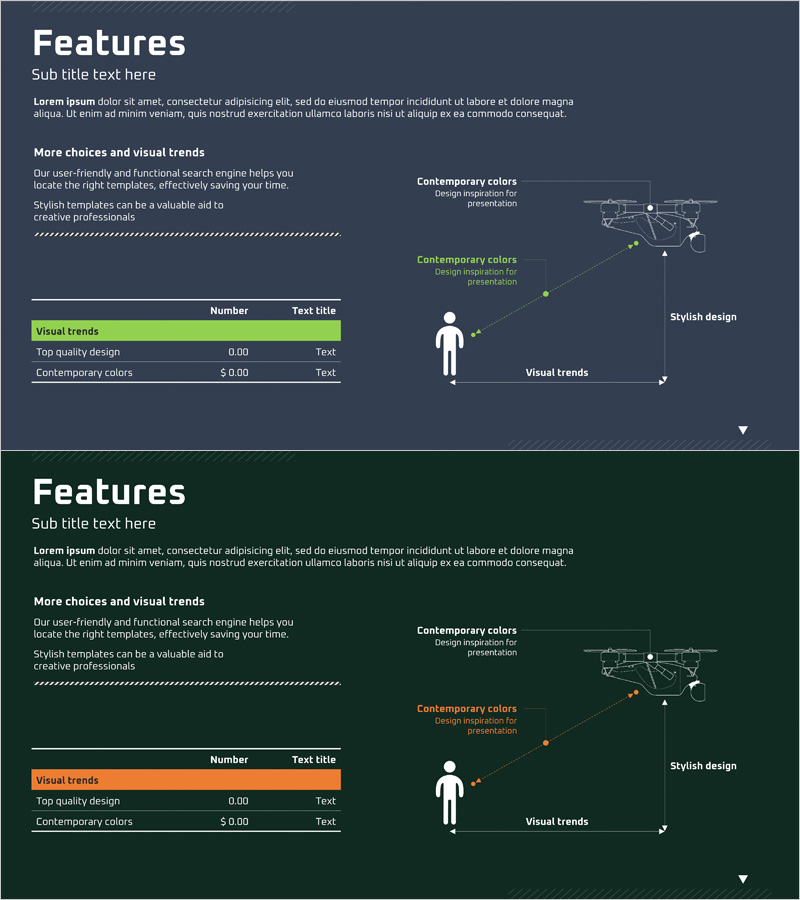
This slide focuses on conveying financial performance effectively through a table chart set against a forest background. The combination of orange and red enhances visibility, making data presentation clear and straightforward. Its table structure is designed to intuitively display data related to budgeting and cash flow. Ideal for business meetings, policy proposals, or financial reports, it allows for easy replacement of text and graphs, with an editing difficulty rated as easy.
Related Products
-
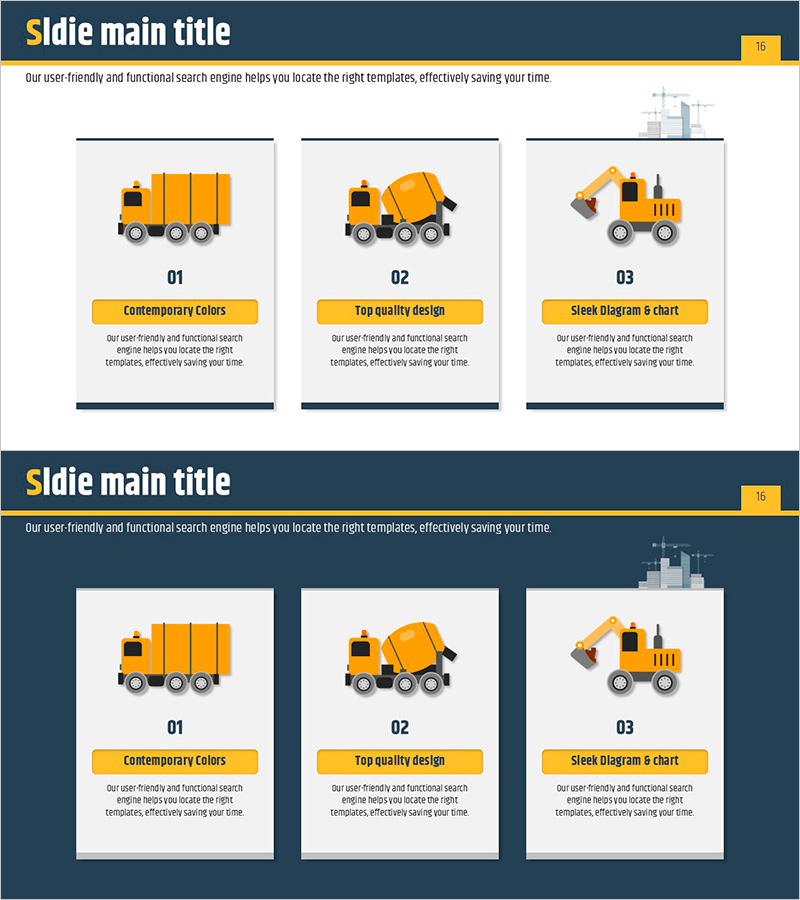
Facility Status and Overview – Visualized with Cluster Diagram
#Business Introduction #Operation Plan #Diagram
-
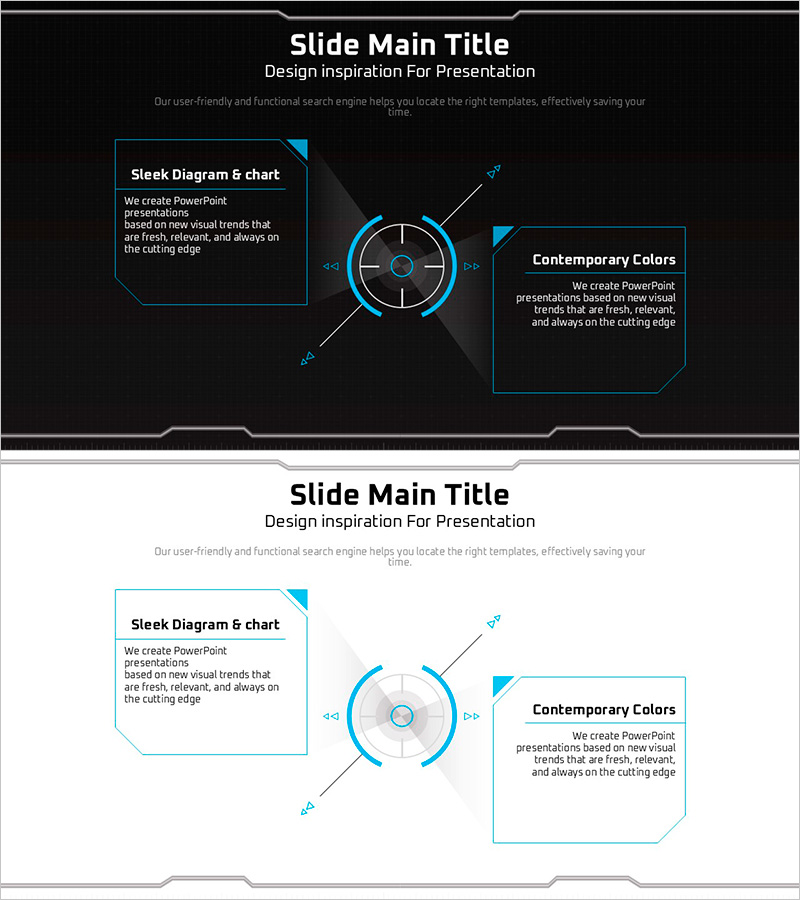
Geometry PowerPoint Template Wide Diagram6 – Optimized for Marketing Strategy & Target Market
#Technology Sector #Marketing Plan and Strategy #Diagram
-
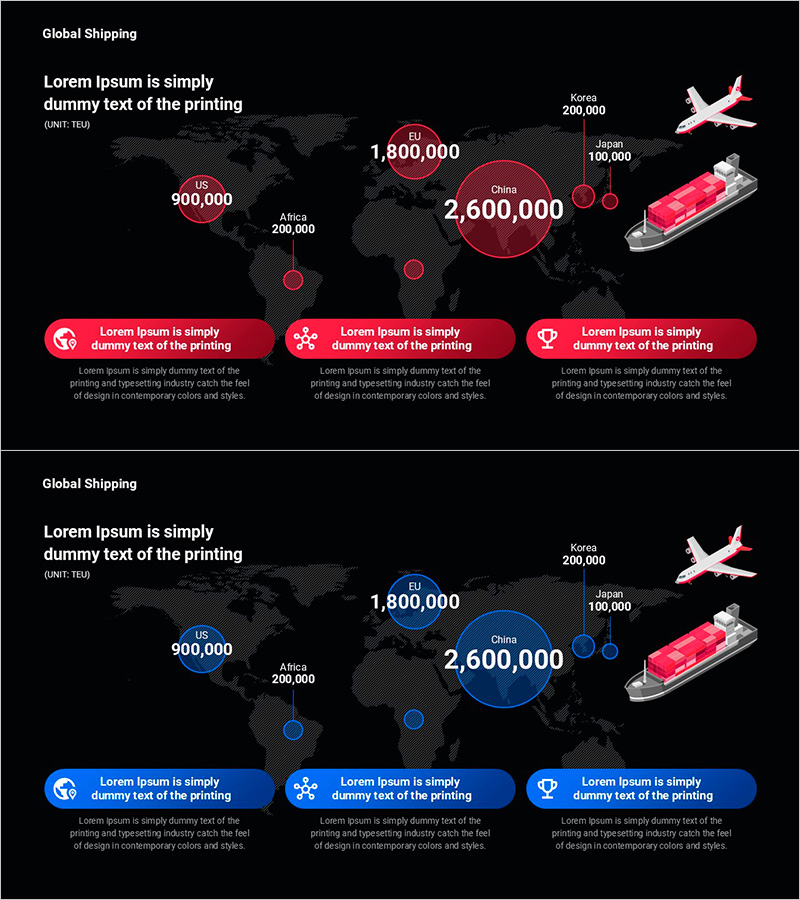
Visualizing Worldwide Maritime Transportation Status – Global Market Strategy
#Company Introduction #Marketing Plan and Strategy #Diagram
-
Drone System Configuration Diagram – Optimized Operations Through Innovative Technology
#Operation Plan #Technology Sector #Diagram
