Market and Competitor Analysis
Visual Slide for Consumer Demand Survey Results
RJ0600088_8
- Last Update 12/21/2025
- File Size 0.4MB
- # of Slides 2
- File Format PPTX
- Slide Ratio 16:9
- Color
Keywords
About the Product
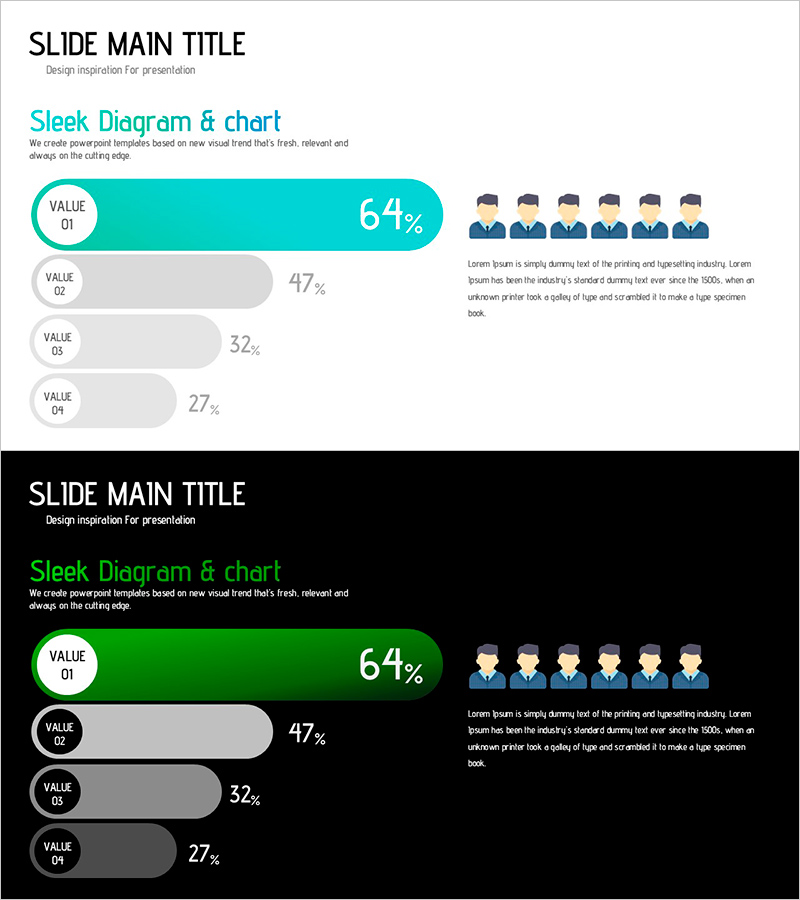
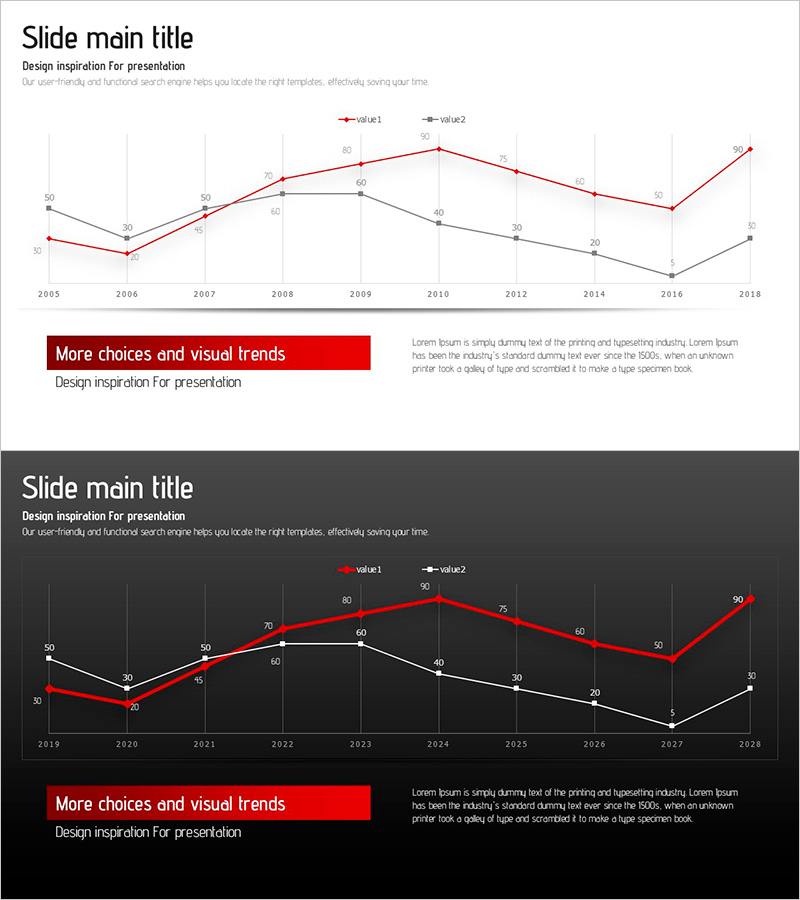
This slide visually represents the consumer demand survey results using sleek graphs and diagrams for effective communication. The overall layout is clear and designed for easy information delivery, balancing green and teal colors to highlight key values and percentages. This design serves as a powerful tool for customer and market analyses in presentations. The text and data fields are easily editable, with an editing difficulty rated as 'easy', allowing for quick integration into various presentations.
Related Products
-
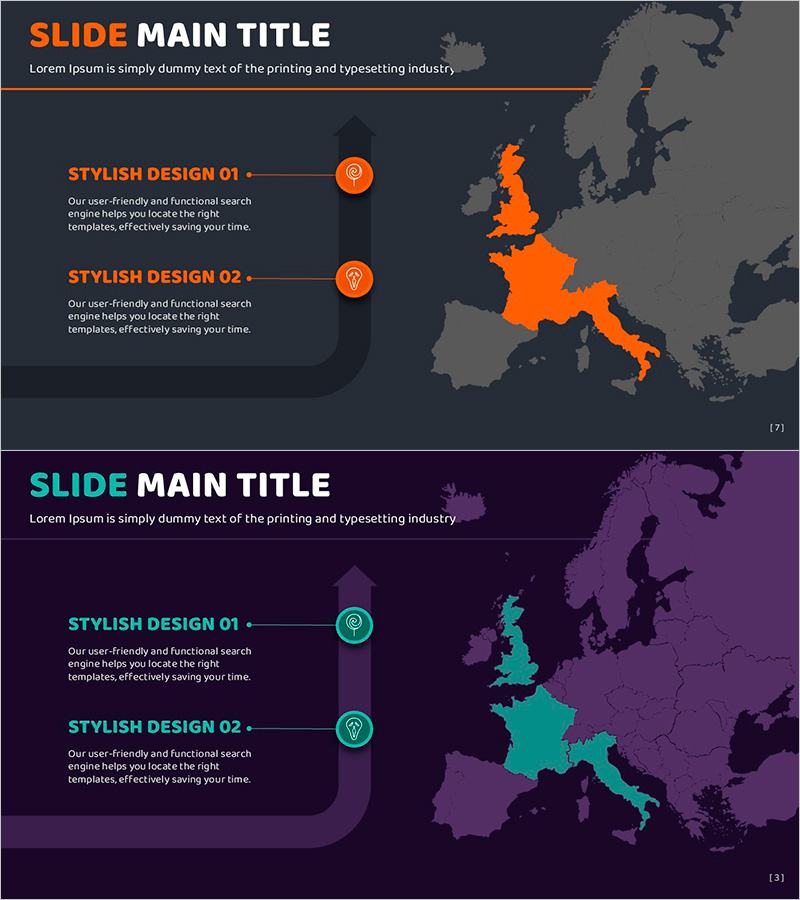
Orange Purple Green Map for Market Strategy Visualization
#Marketing Plan and Strategy #Other #Target Market Strategy
-
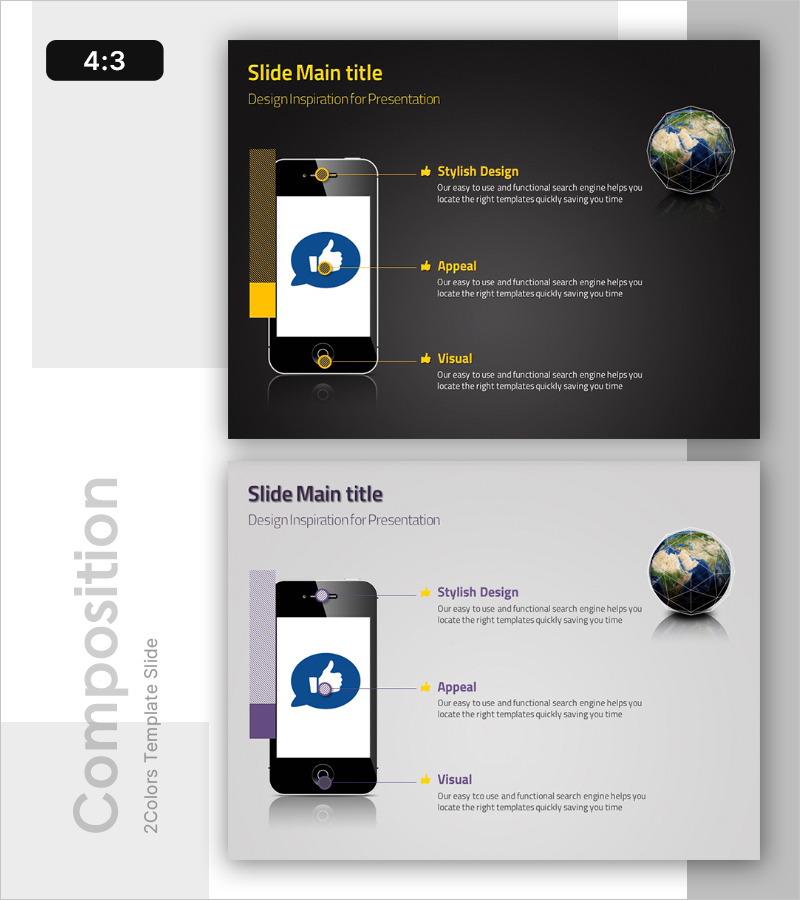
Diagram Showcasing Mobile App Service Configuration
#Product/Service #Diagram #Other
-
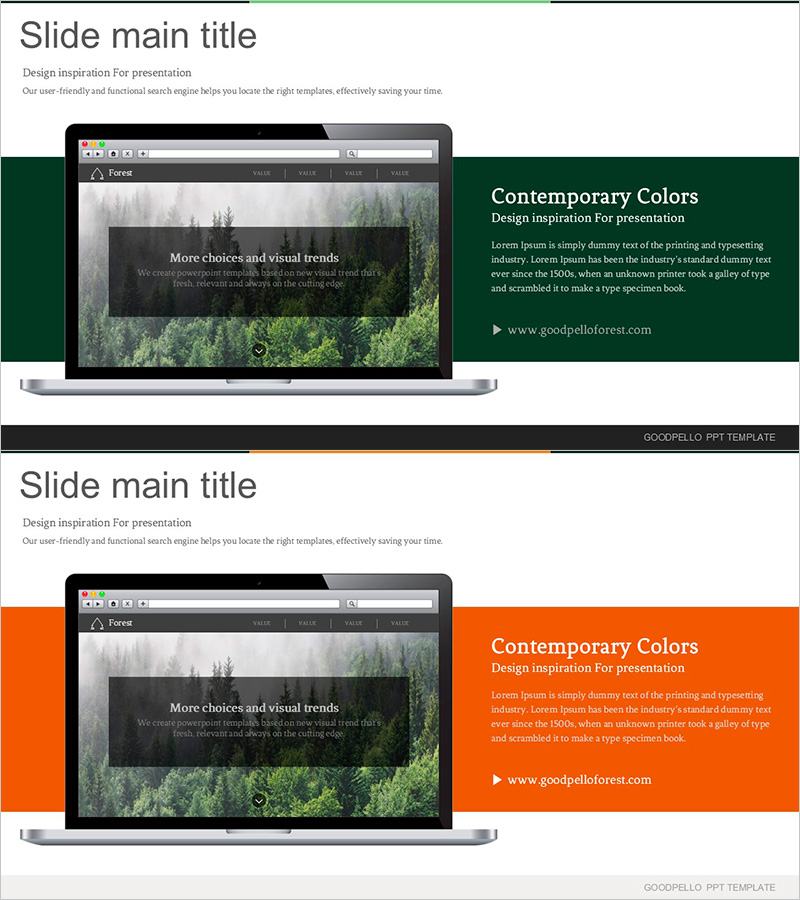
Forest Environment Home Page Template – Optimized for Marketing Strategy
#Slide Type #Marketing Plan and Strategy #Other
-
Origami Presentation Template Section Line Graph – Market and Performance Analysis
#Market and Competitor Analysis #Financial Plans and Performance #Graph
