Business Promotion Strategy
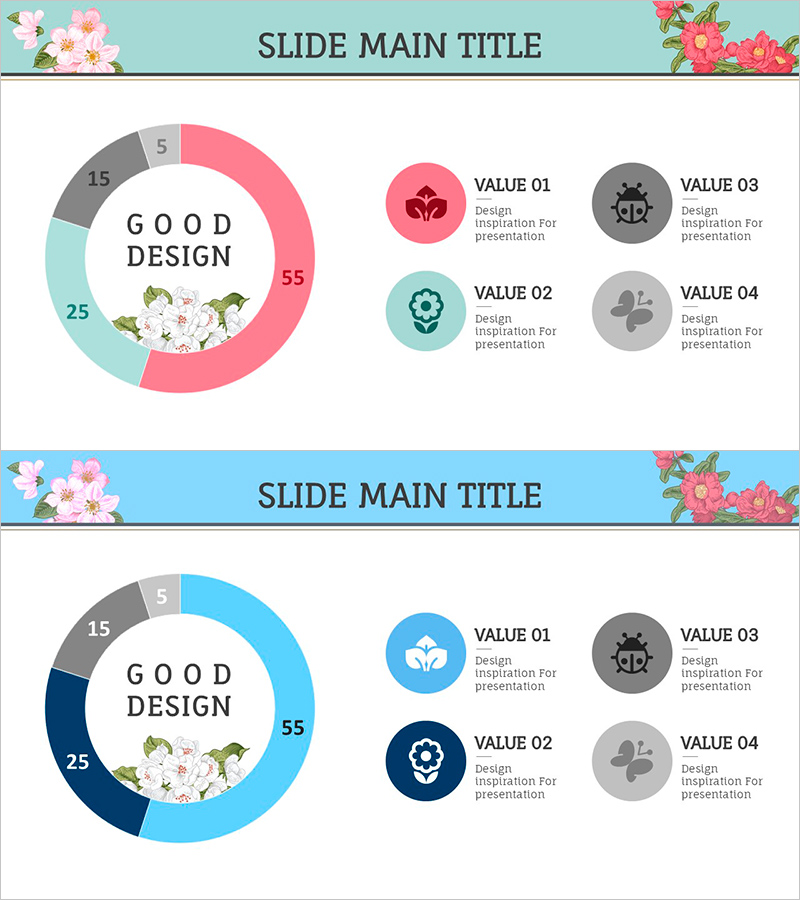
Donut Charts of Animals and Plants – Effective Market Analysis Tool
RJ0600084_9
- Last Update 12/21/2025
- File Size 0.5MB
- # of Slides 2
- File Format PPTX
- Slide Ratio 16:9
- Color
Keywords
About the Product
This slide features a donut chart to intuitively display the distribution and ratios of animals and plants. It showcases a harmonious color scheme, with eye-catching graphical elements. The key colors are green, blue, and red, allowing for easy visual differentiation between categories. This slide is ideal for professional business presentations related to market share analysis or strategic business discussions. It clearly conveys information, emphasizing company performance, and is rated as 'easy' for editing, allowing for quick adjustments of text and data.
Related Products
-
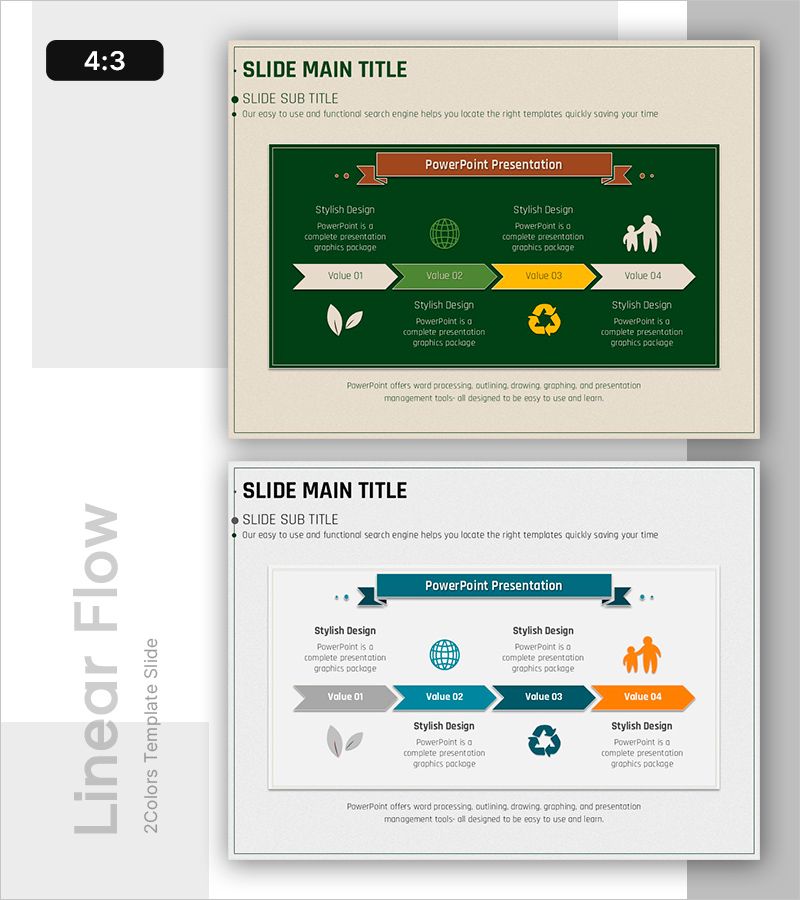
Green Practice Strategy Process – Utilizing Inclusive Cluster Diagram
#Business Promotion Strategy #Operation Plan #Diagram
-
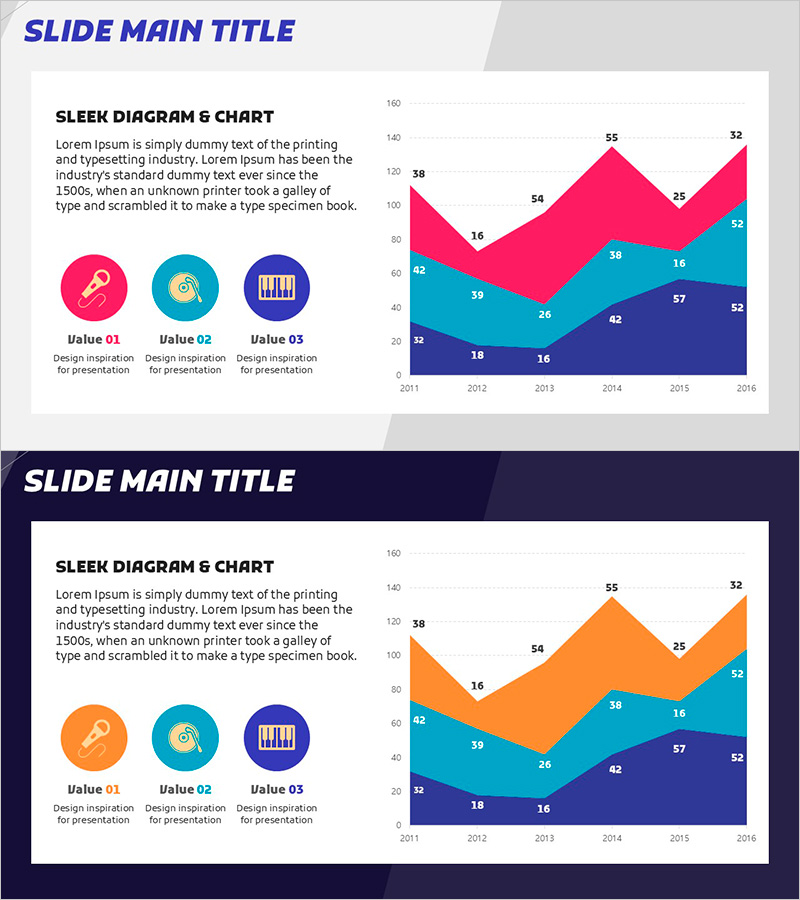
Graph Trend by Instrument Session – Competitive Analysis Visualization
#Market and Competitor Analysis #Graph #Other
-
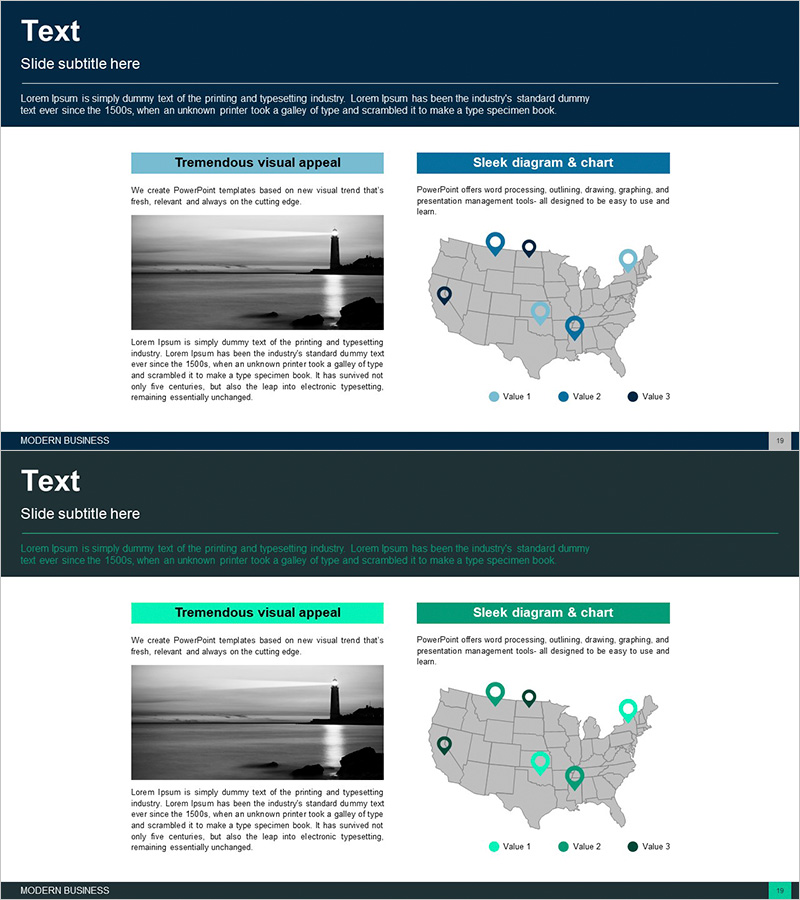
Presentation Template for Target Analysis in the US Region
#Market and Competitor Analysis #Marketing Plan and Strategy #Other
-

Network Marketing Plan and Organization – Strategic Approach for Business Growth
#Business Promotion Strategy #Technology Sector #Diagram
