Technology Sector
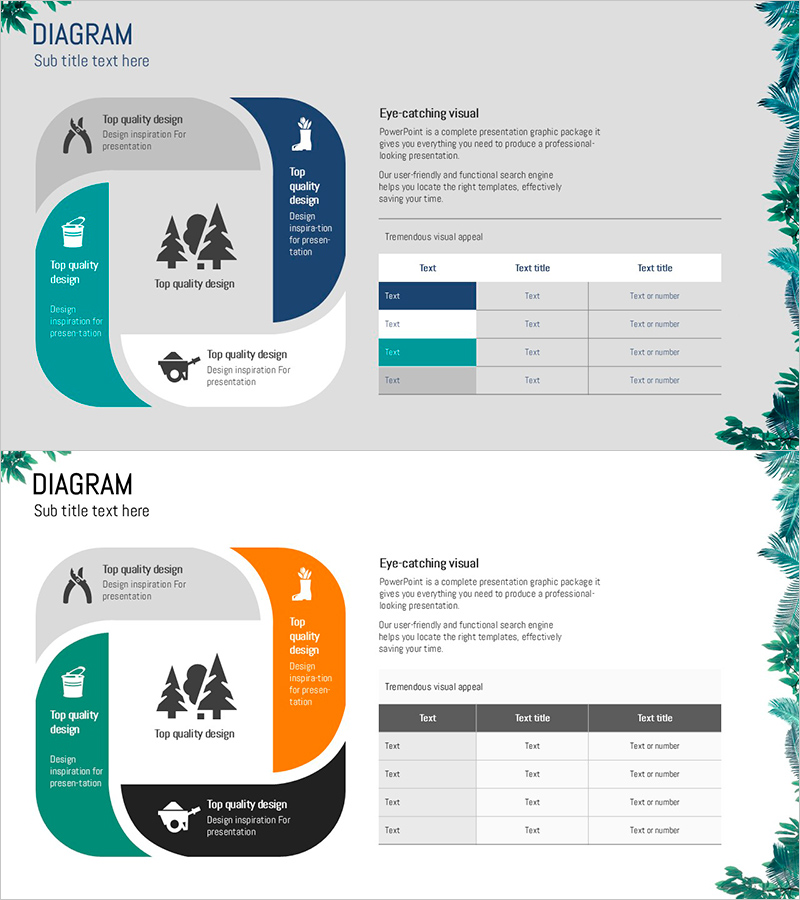
Gardening System - Effective Service Operation Diagram
RJ0600083_23
- Last Update 12/21/2025
- File Size 0.5MB
- # of Slides 2
- File Format PPTX
- Slide Ratio 16:9
- Color
Keywords
About the Product
This slide is designed to visually convey effective service operations for gardening systems through a diagram. With a combination of vibrant colors, it enhances clarity and effective communication. The design employs clusters to illustrate the relationships between various elements, allowing for easy understanding of the information. This slide is particularly useful for explaining operational strategies in the technology sector, catering to practitioners and presenters alike. The text and data are easily replaceable, with an editing difficulty rated as 'easy'.
Related Products
-
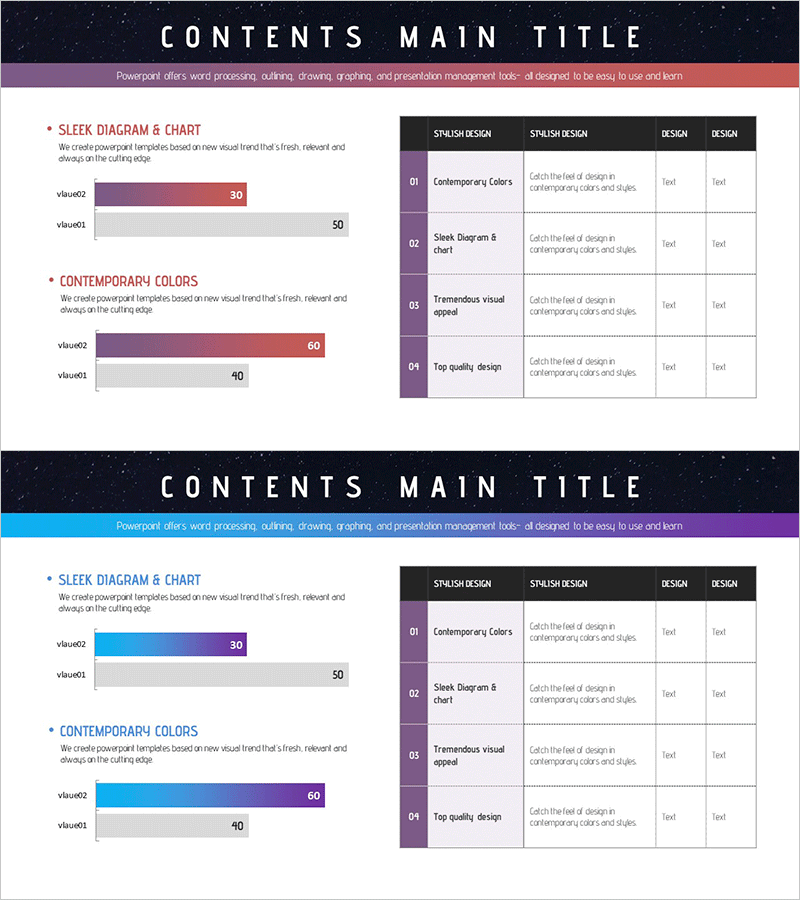
Bar Graphs & Tables – New Dimension of Data Visualization
#Market and Competitor Analysis #Diagram #Graph
-
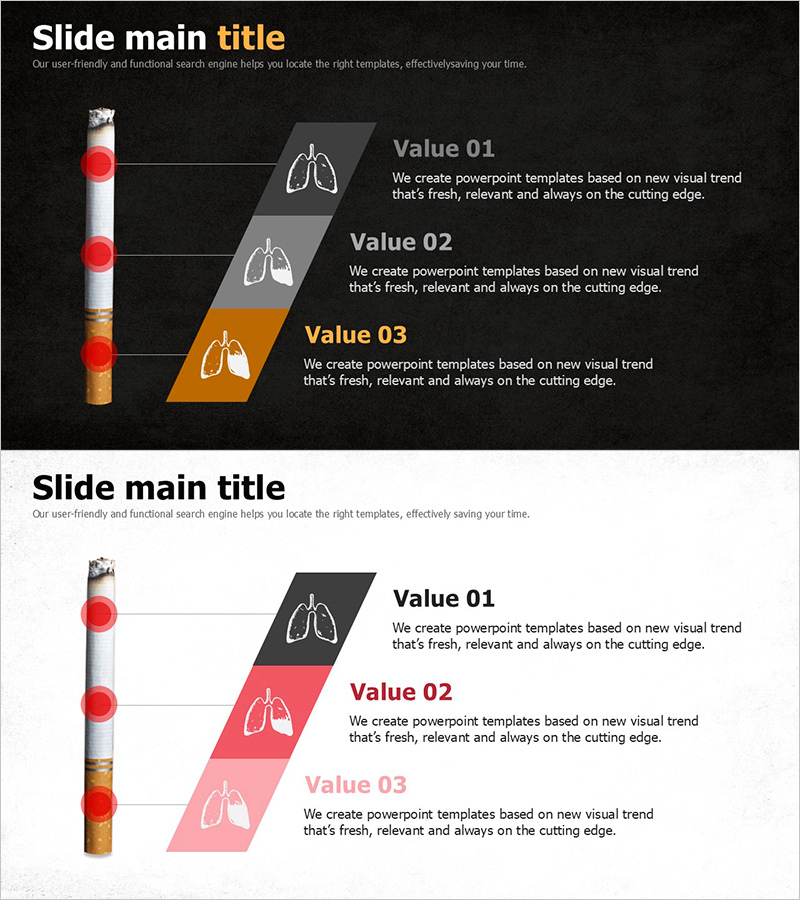
Single Slide Template for Visualizing Stages of Lung Cancer
#Business Promotion Strategy #Diagram #Phase-wise Schedule Plan
-

Work Capabilities Analysis Diagram – Analysis of Key Personnel Work Performance
#Company Introduction #Market and Competitor Analysis #Diagram
-

Four Key Strategies for Team Success – Diagram for Collaborative Outcomes
#Business Vision and Strategy #Diagram #Business Strategy
