Business Introduction
Renewable Energy Icons and Hexagonal Pie Charts
RJ0600067_4
- Last Update 12/21/2025
- File Size 0.3MB
- # of Slides 2
- File Format PPTX
- Slide Ratio 16:9
- Color
Keywords
About the Product
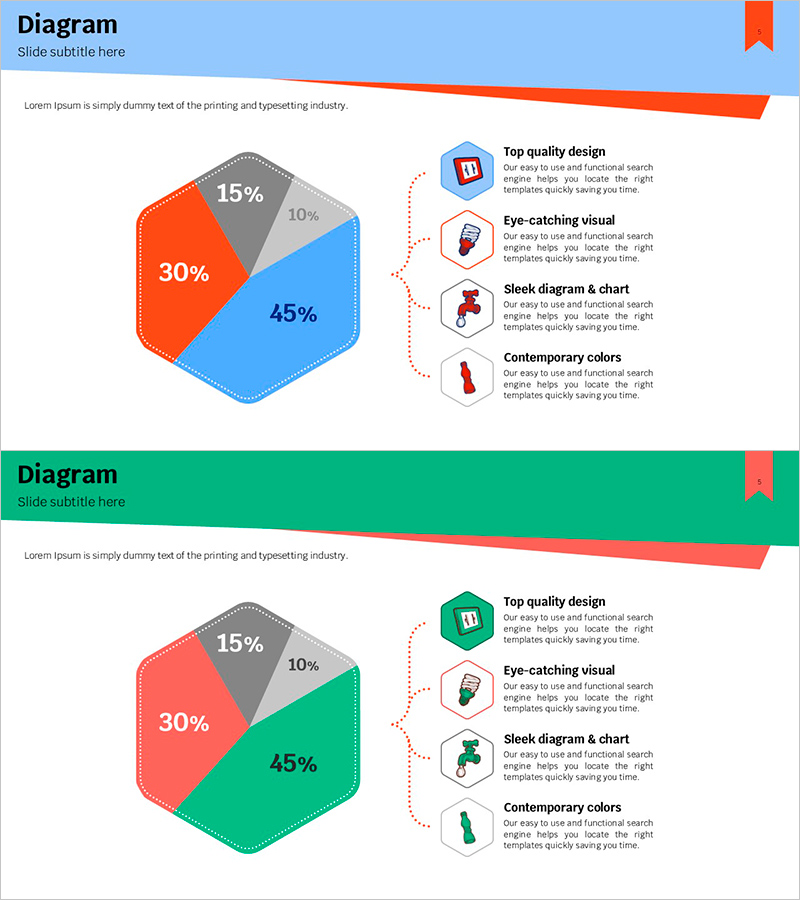
This slide is a presentation template that visually represents renewable energy-related information using hexagonal pie charts. The segmented pie chart helps easily understand the distribution of energy sources at a glance. It is effective for introducing business and technical status, and the modern color scheme attracts the audience's attention. Text and chart modifications are straightforward, with an editing difficulty rated as 'easy', providing an immediately usable resource for various business contexts.
Related Products
-
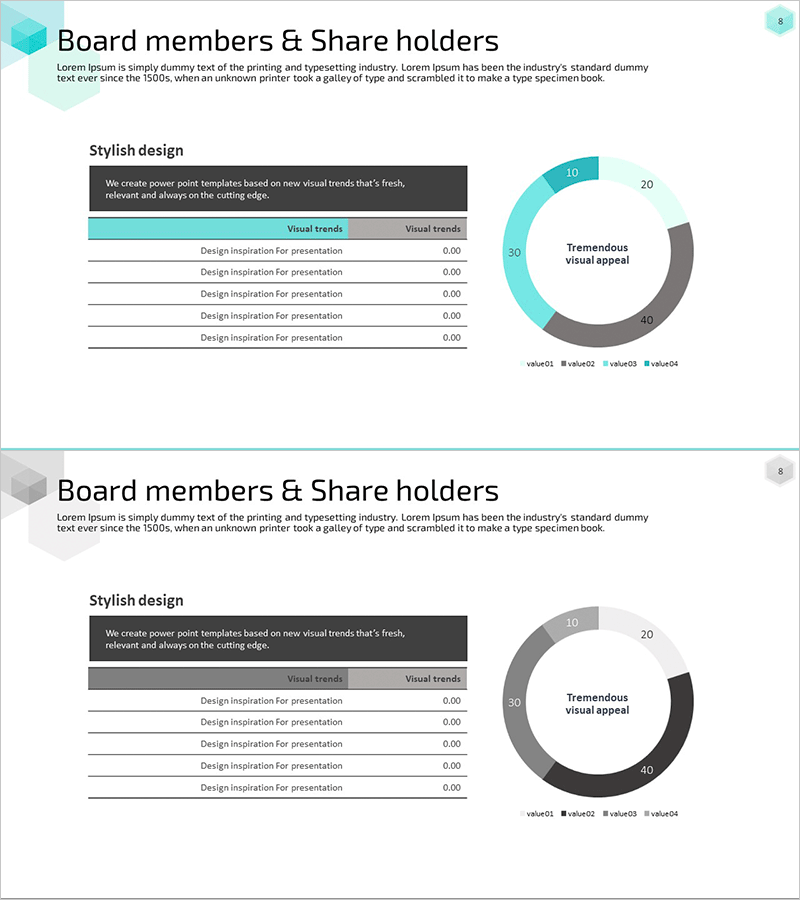
Status Analysis Donut Chart – Shareholder Status Analysis
#Company Introduction #Market and Competitor Analysis #Diagram
-
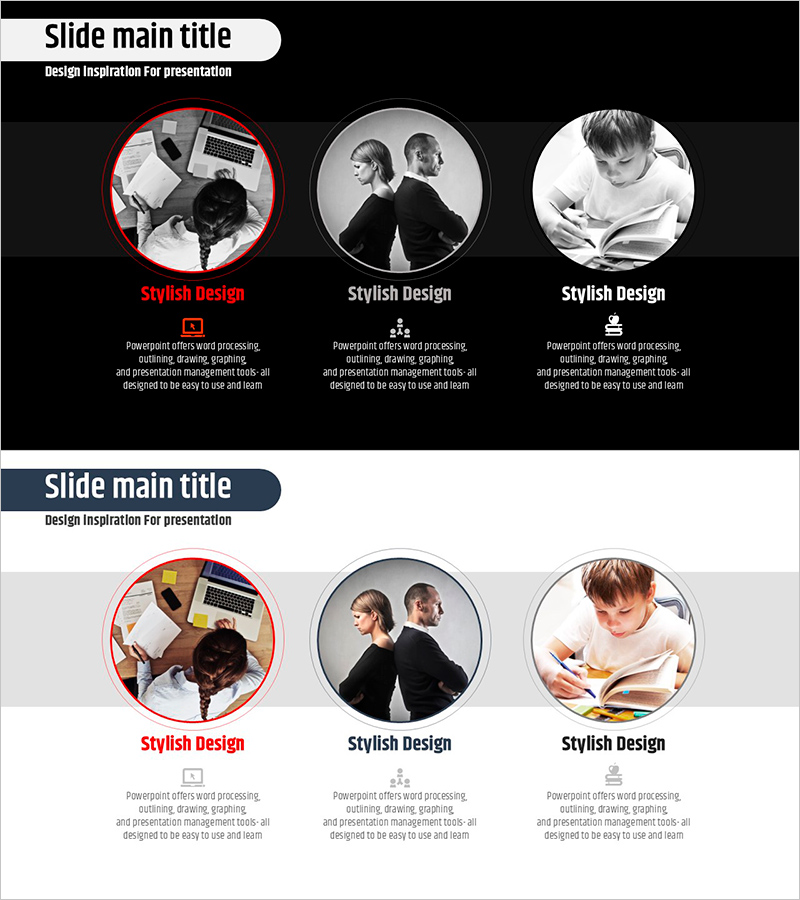
Diagram Slide for Work and Family Stress Management
#Product/Service #Business Vision and Strategy #Diagram
-

Business Leader Introduction Slide – Team Member Visualization
#Company Introduction #Diagram #Manpower
-
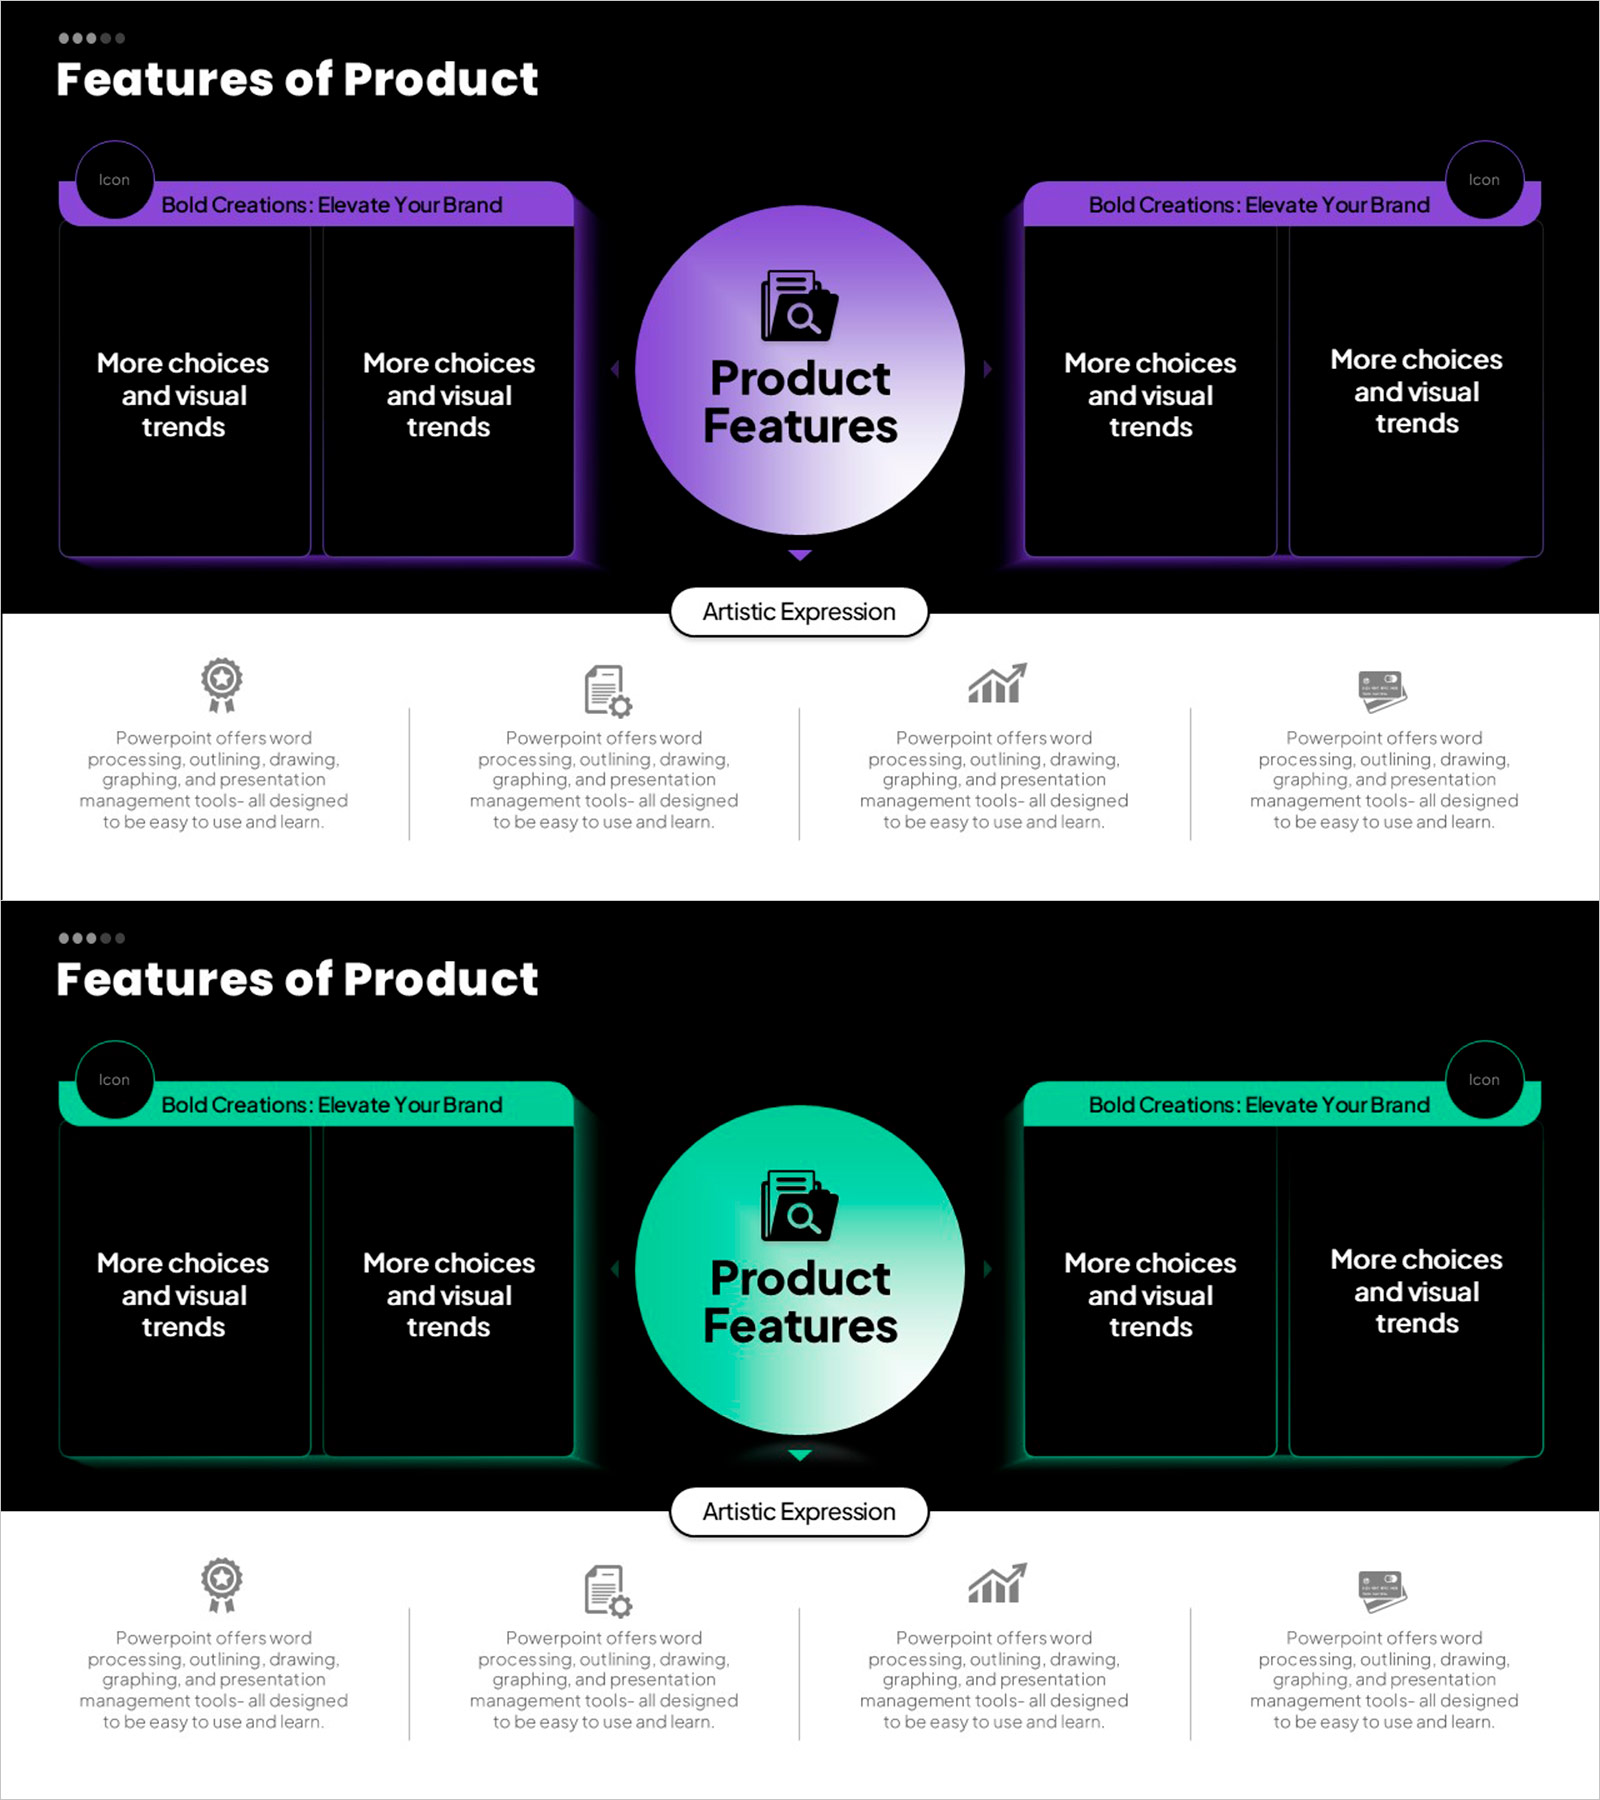
Key Feature Analysis Slide – Visualizing Product Features
#Product/Service #Diagram #Features
