Market and Competitor Analysis
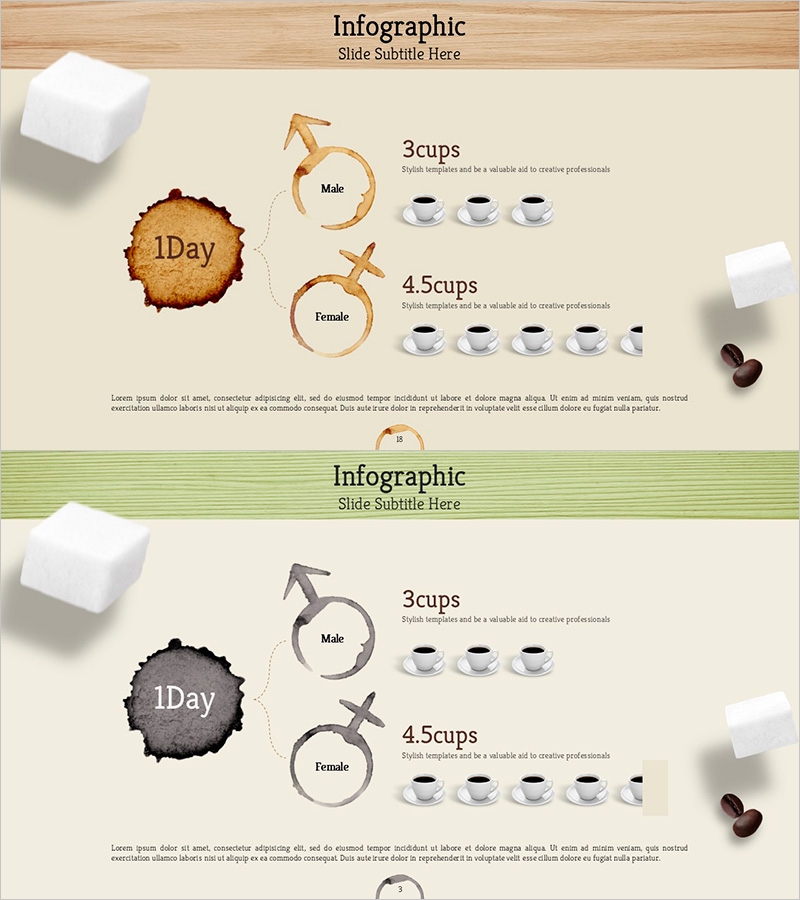
Coffee Consumption Survey by Gender – Visual Data Infographic
RJ0600057_17
- Last Update 12/21/2025
- File Size 4.9MB
- # of Slides 2
- File Format PPTX
- Slide Ratio 16:9
- Color
Keywords
About the Product
This slide is a visual infographic representing coffee consumption by gender, highlighting key data points of '3 cups (Male)' and '4.5 cups (Female)'. With a clear data comparison structure, this diagram is well-suited for various market analysis reports and customer analysis materials. The use of brown and green tones evokes a natural coffee feel, with distinct separations between the title area and data section. This material can be effectively utilized in brand marketing, customer trend analysis, and academic research. The text and data fields are easy to replace, and the editing difficulty is rated as 'easy'.
Related Products
-
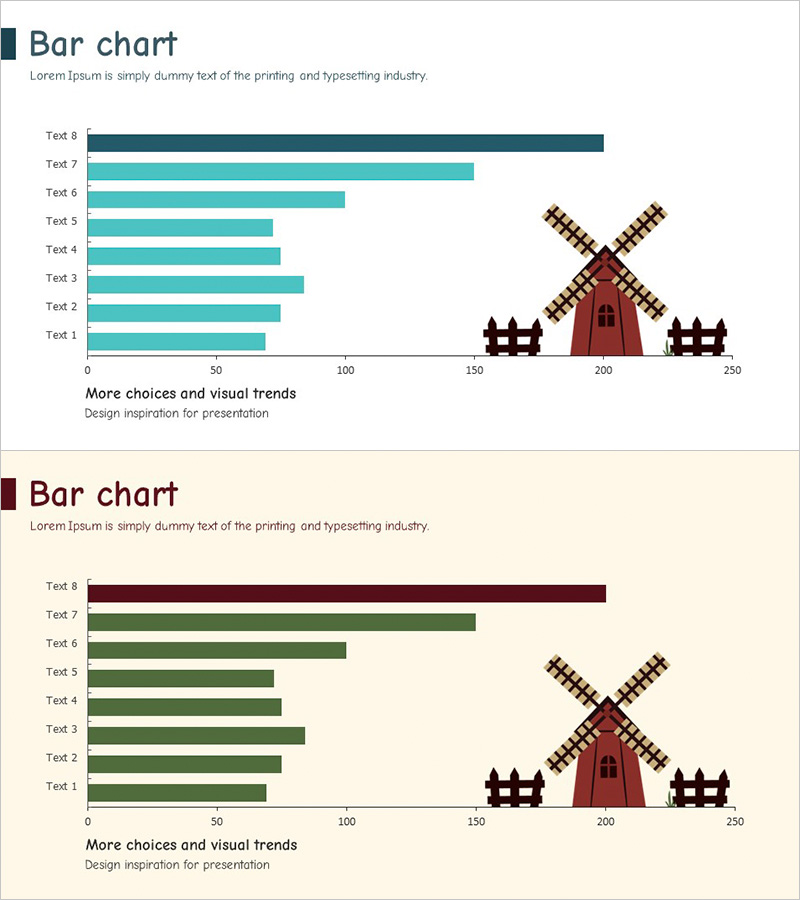
Farm Bar Graph for Market Analysis – Formulating Effective Business Strategies
#Business Promotion Strategy #Market and Competitor Analysis #Graph
-

Business Marketing Differentiation Strategy – Visually Appealing Donut Chart Slide
#Product/Service #Marketing Plan and Strategy #Graph
-
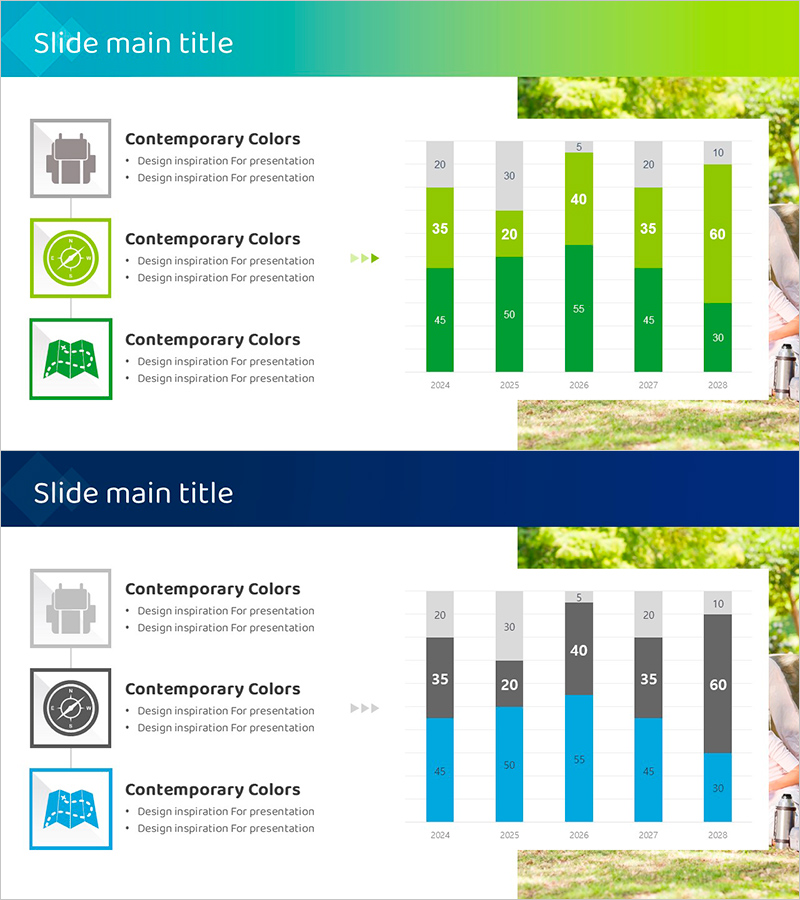
Backpack Travel Trends – Market Growth Forecast
#Market and Competitor Analysis #Graph #Industry Trends
-
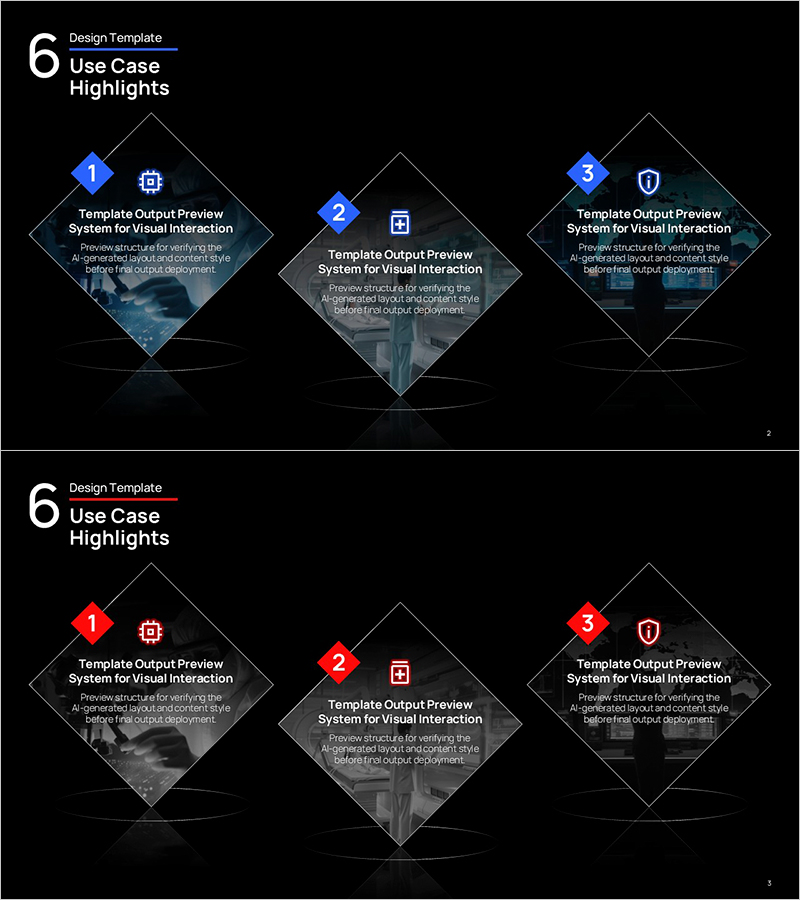
AI Neon Rhombus Visual Template – Innovation and Future
#Product/Service #Diagram #Composition
