Emotional Messages
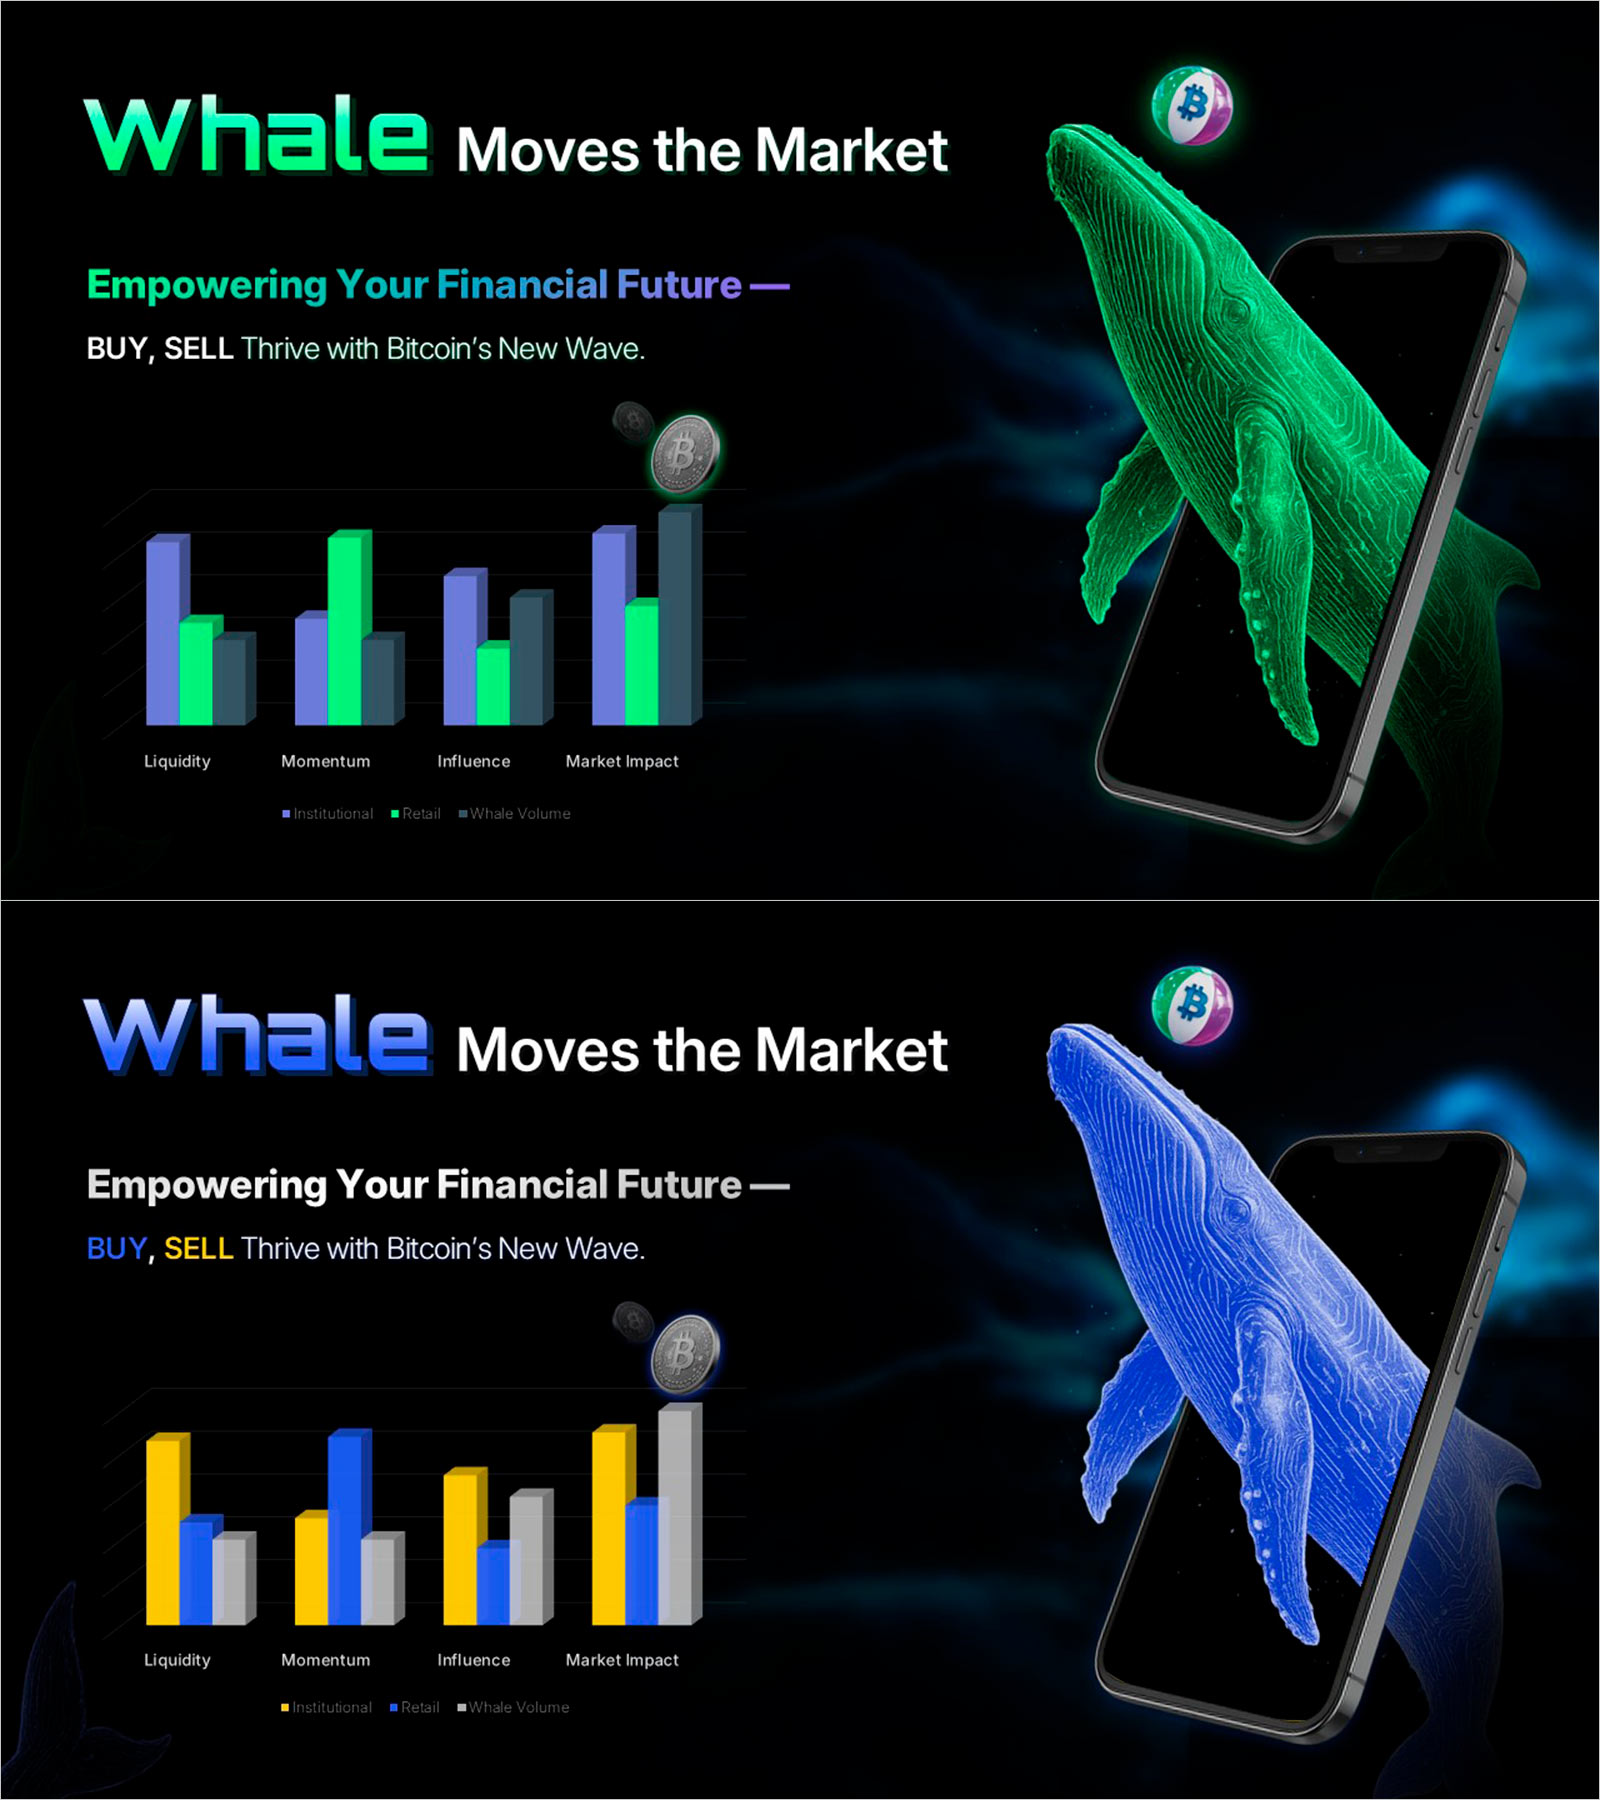
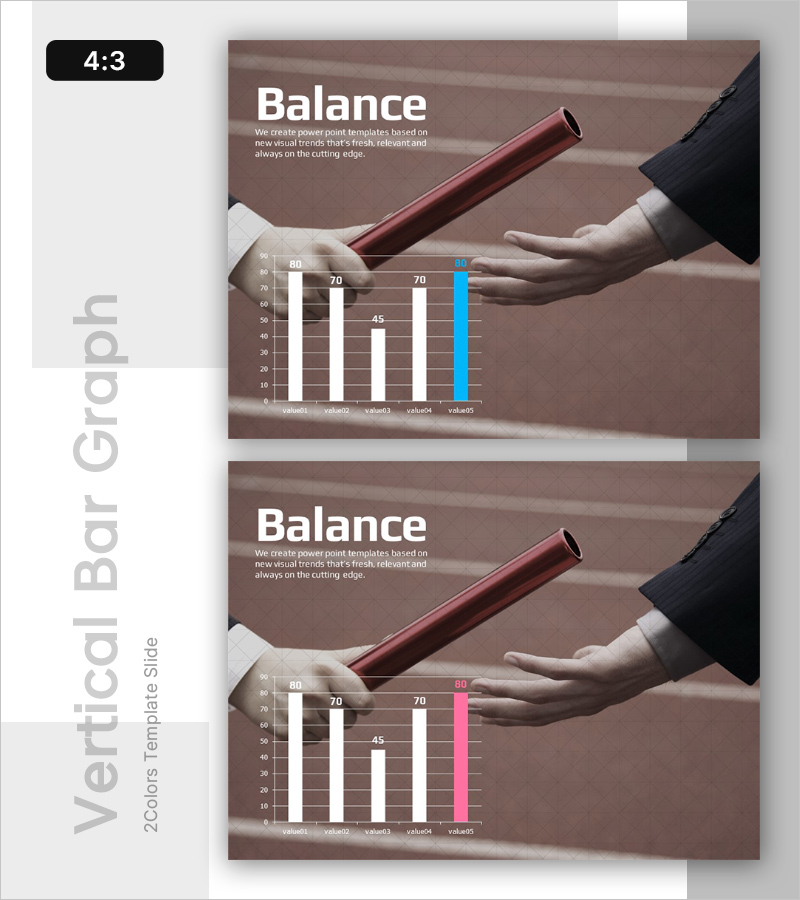
Vertical Bar Analysis Graph – Essential Tool for Market and Competitor Analysis
RL0100014_3
- Last Update 12/21/2025
- File Size 2MB
- # of Slides 2
- File Format PPTX
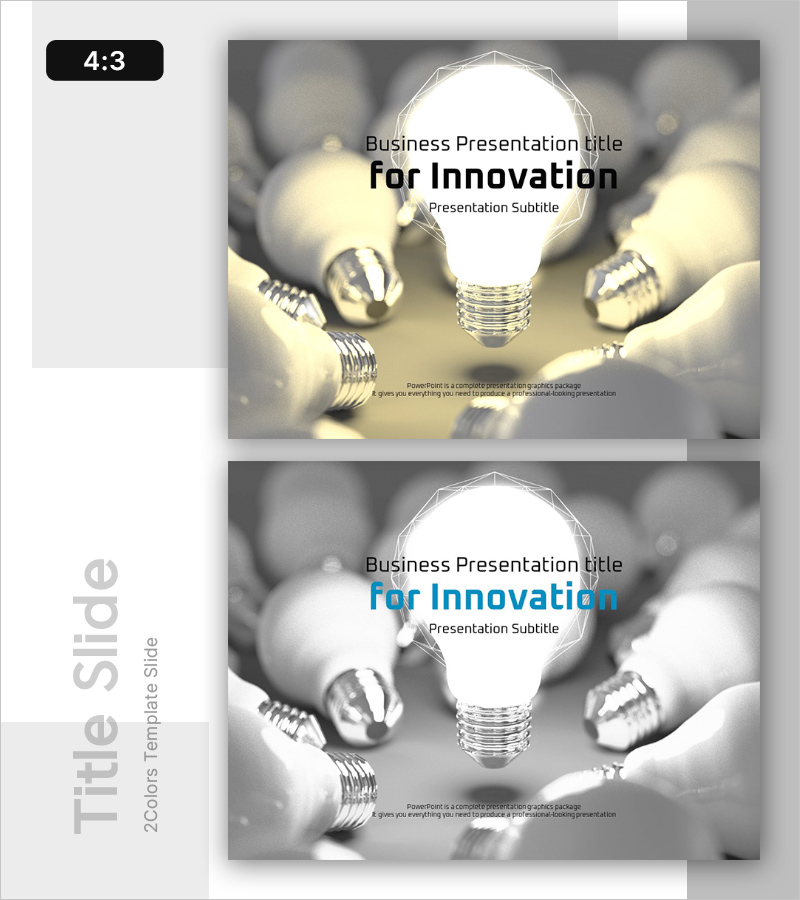
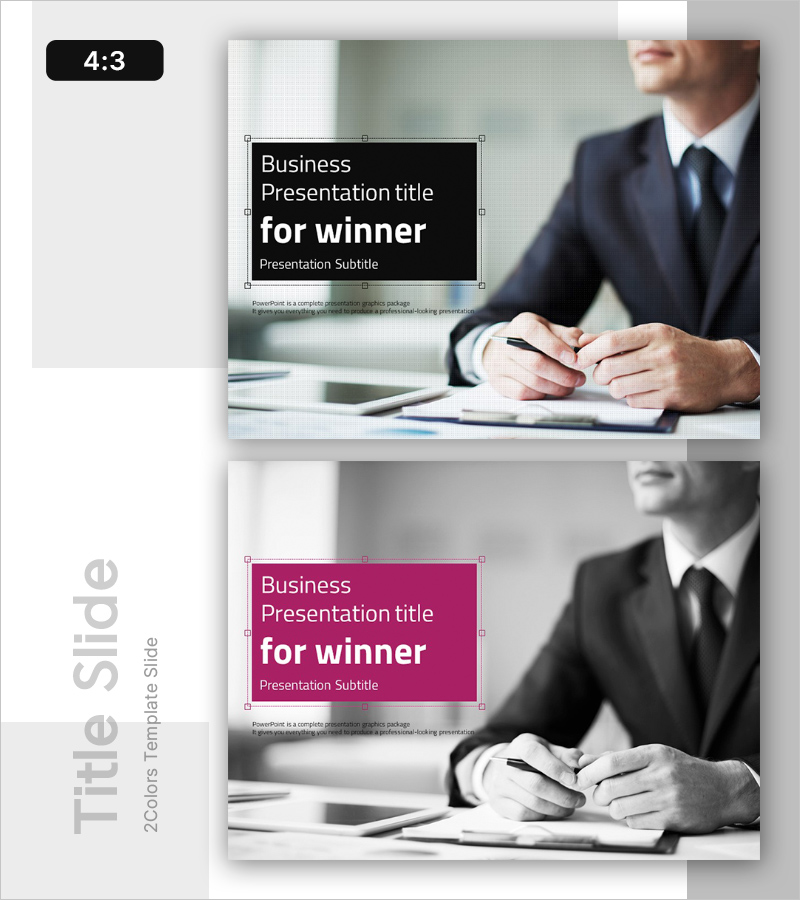
- Slide Ratio 4:3
- Color
Keywords
About the Product
This slide utilizes a vertical bar graph to clearly visualize market and competitor analysis results. The contrasting blue and red color scheme enhances data readability, while the large title area at the top allows for conveying the core message at a glance. This slide is ideal for comparing performance between the first and second half of the year or analyzing competitors' market shares, with the flexibility of easy and quick editing. Infused with positive emotional messaging like achieving goals and emphasizing performance, it's well-suited for presentations aimed at investors or management reports.