Whale Moves the Market
RL0100100_5
- Last Update 11/19/2025
- File Size 23.5MB
- # of Slides 2
- File Format PPTX
- Slide Ratio 16:9
- Color
Slide Preview


Keywords
About the Product
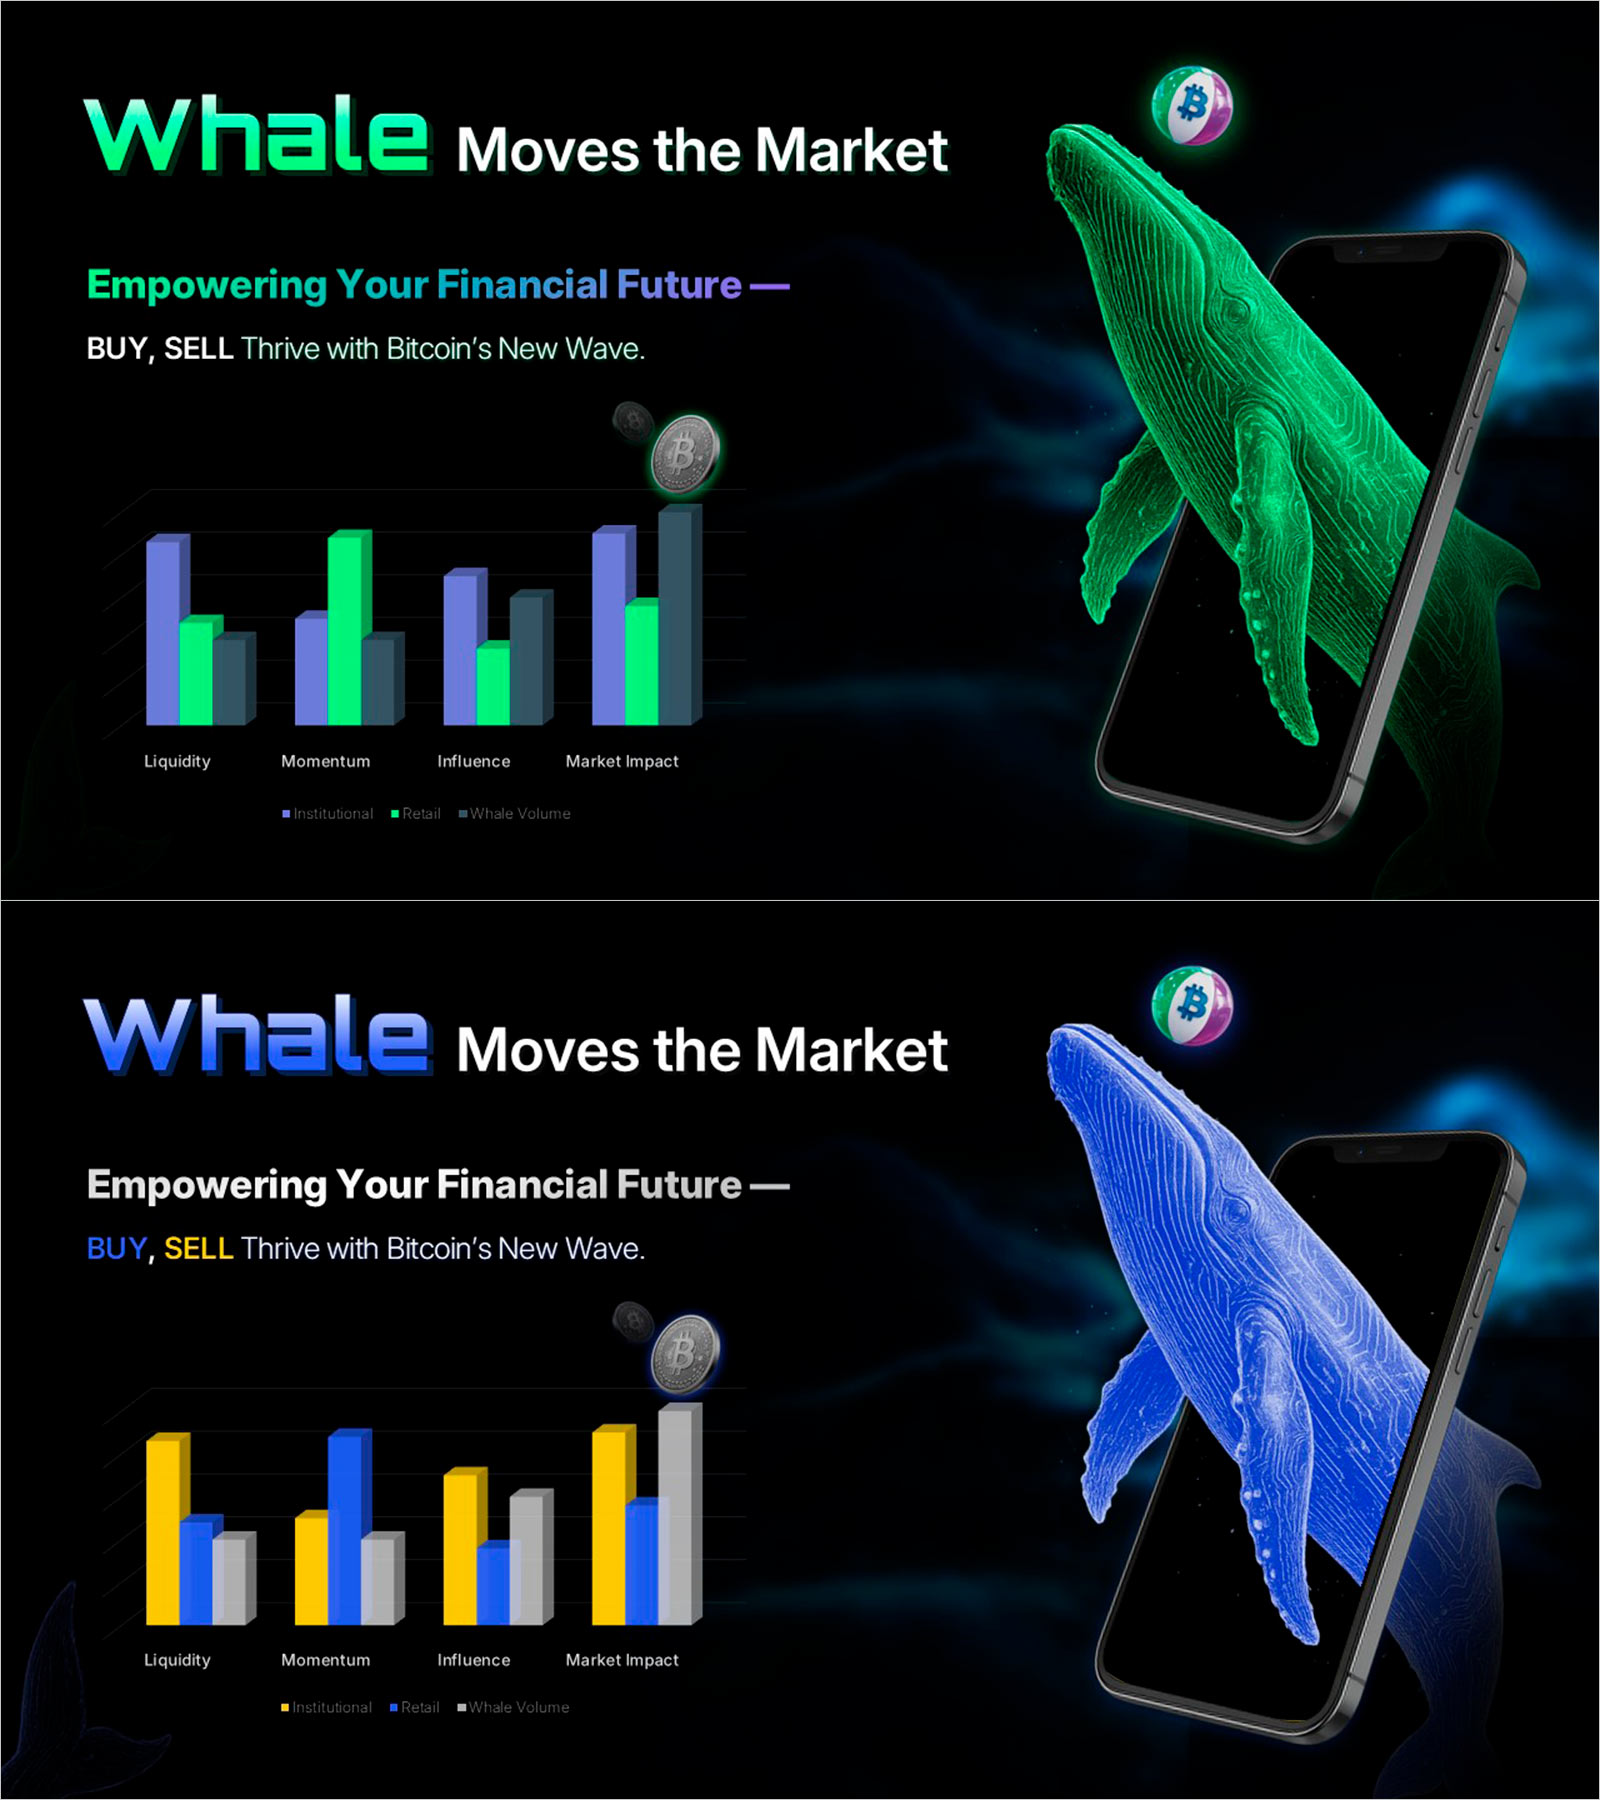
A PowerPoint slide analyzing the market influence of large cryptocurrency investors (whales) across four key metrics: liquidity, momentum, influence, and market impact. The parallel bar chart visualization enables traders and investors to quickly assess whale behavior patterns critical for Bitcoin trading strategy development. Set against a black background with neon green and purple accent colors, the design conveys financial sophistication suitable for cryptocurrency investment seminars, trading education, and market analysis presentations. The 2-slide set presents identical data in two color variations (green-purple and blue-yellow), allowing you to select the version that best matches your presentation environment and audience.
Usage Points
-
Main Usage
Quantitatively compare and analyze the liquidity, momentum, influence, and market impact of large cryptocurrency investors (whales) to support investment decision-making. This slide is essential for understanding market leader behavior patterns when developing Bitcoin trading strategies and explaining crypto market dynamics.
-
How to Use
Deploy this slide during investment seminars, trading education sessions, and market analysis presentations when explaining whale investor influence. Compare bar heights across the four metrics to emphasize relative strength in each category, and use color variations to maintain visual engagement. Select the color scheme (green-purple or blue-yellow) that best complements your presentation background and overall tone.
-
Recommended For
Cryptocurrency investors, traders, financial analysts, investment educators, and fintech professionals benefit from using this slide for market analysis and strategy development. Recommended for Bitcoin investment strategy presentations, trading risk management discussions, and investor education materials.
-
Slide Structure
The 2-slide set displays identical 4-metric data (liquidity, momentum, influence, market impact) in parallel bar chart format. Slide 1 features neon green and purple accents; Slide 2 uses blue and yellow tones, enabling flexible selection based on presentation context. Each slide includes title and subtitle input areas at the top for customization and branding.


