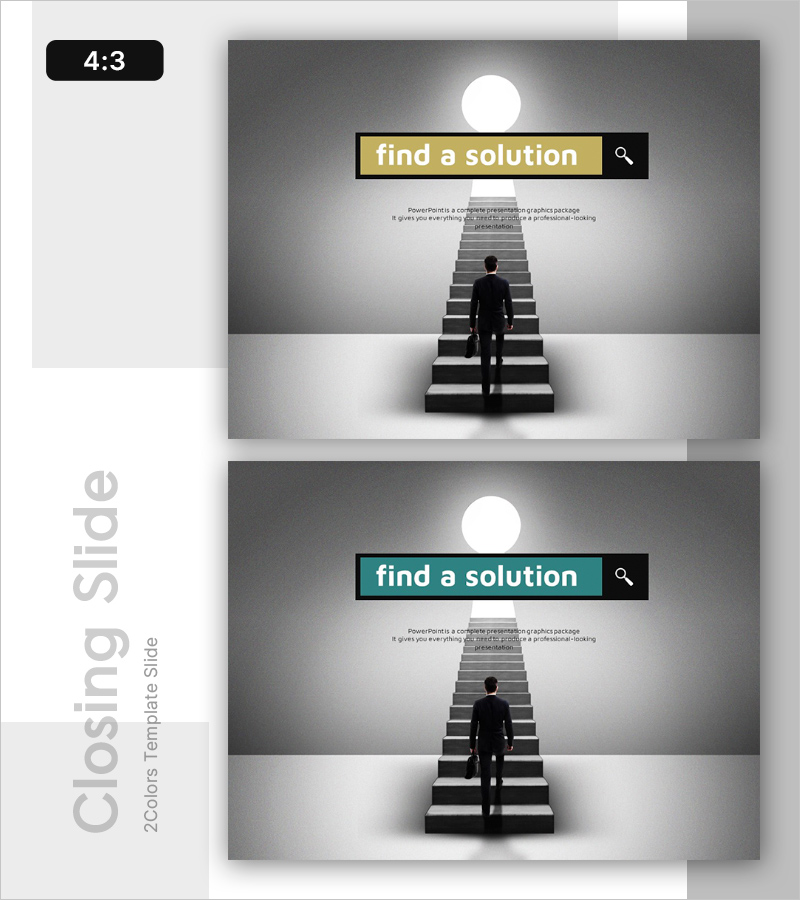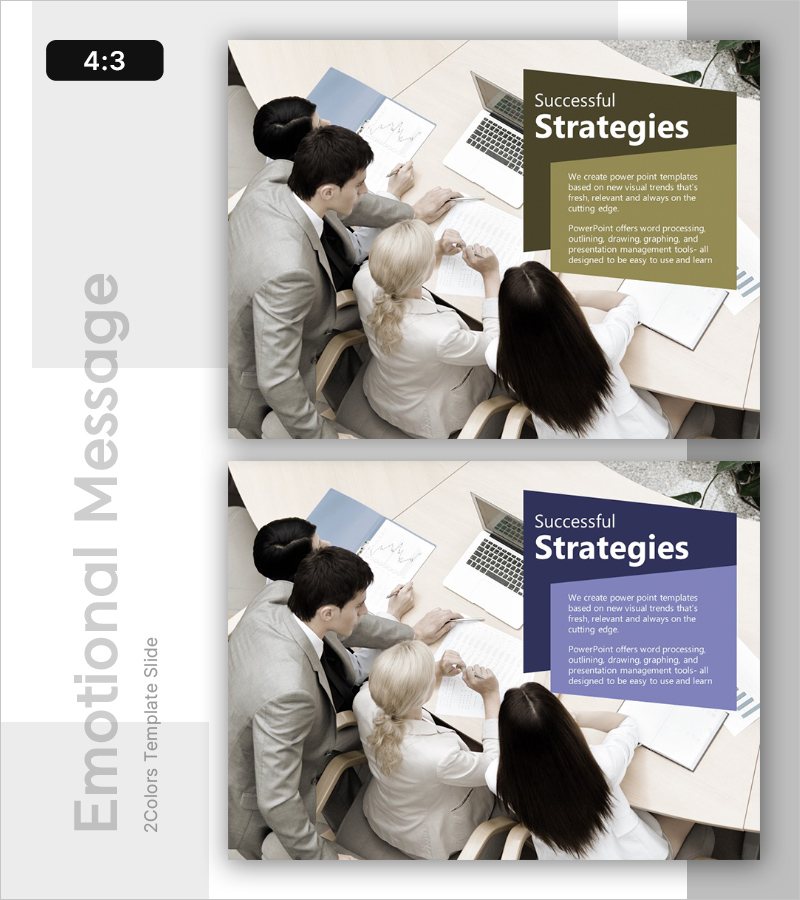
Emotional Messages
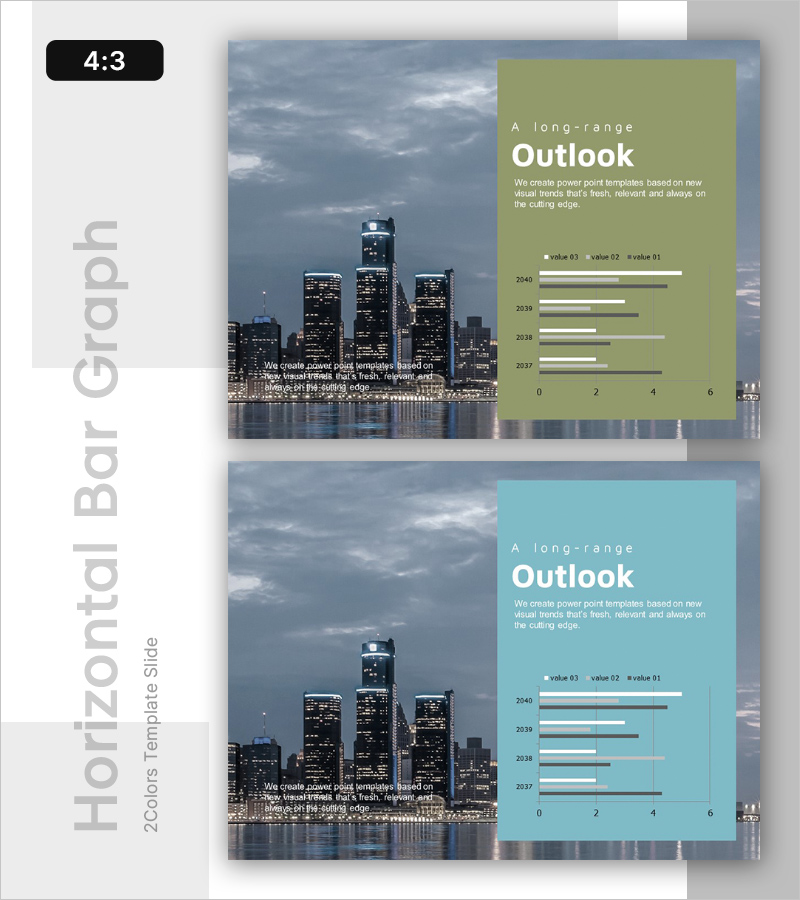
Business Outlook Analysis Graph – Data Visualization for Competitive Enhancement
RL0100005_3
- Last Update 12/21/2025
- File Size 2.1MB
- # of Slides 2
- File Format PPTX
- Slide Ratio 4:3
- Color
Keywords
About the Product
This slide utilizes horizontal bar graphs to visually analyze business outlook with a simple design and intuitive data representation, making it effective for case studies and future planning. The combination of green and blue colors conveys reliability while presenting a fresh visual appeal. It is particularly suitable for business presentations focusing on market and competitor analysis or developing growth strategies, and offers an easy editing structure that allows business professionals to quickly implement data.