Business Vision and Strategy
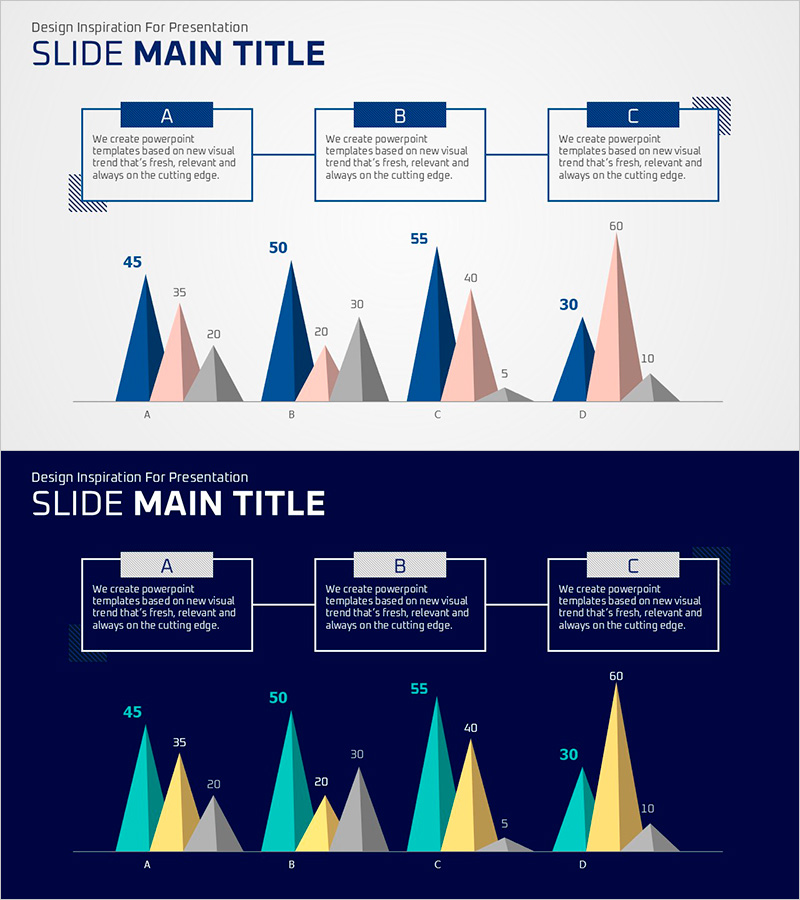
3D Triangle Graph for Market Analysis – Strategic Insights
RJ0500028_28
- Last Update 12/21/2025
- File Size 0.2MB
- # of Slides 2
- File Format PPTX
- Slide Ratio 16:9
- Color
Keywords
About the Product
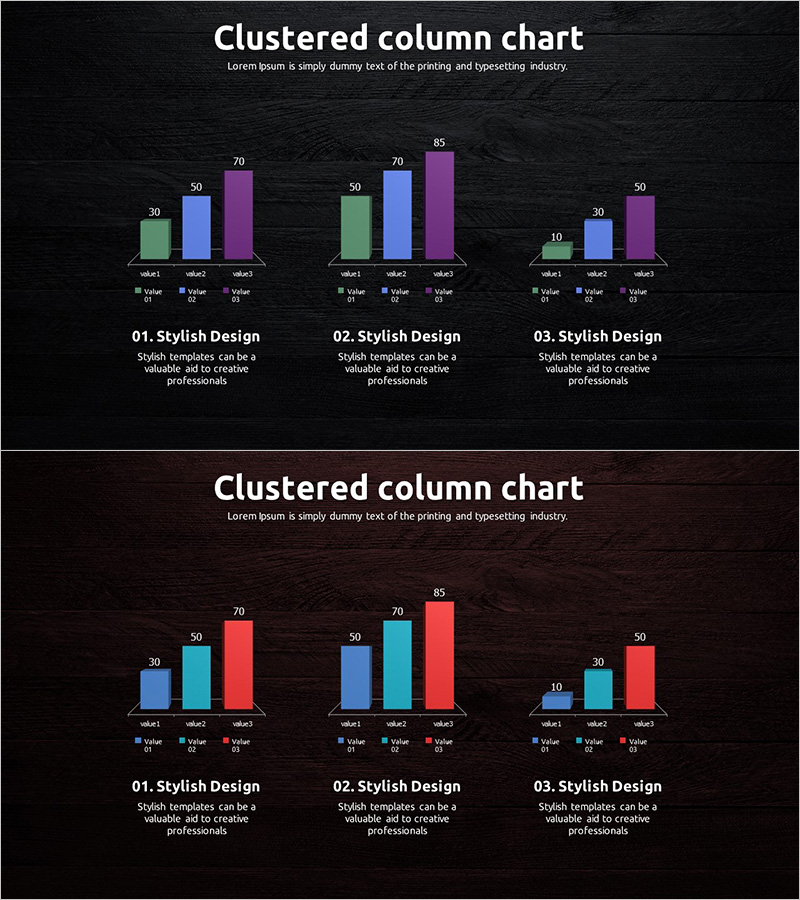
This slide utilizes a 3D triangle graph to intuitively present market and competitor analysis content. The graph visually expresses multiple data points, with a readable title area at the top and highlighted specific figures in the data section below. It is designed with a deep navy and teal color scheme that provides stability and helps users easily comprehend complex information. This slide serves as a powerful visual aid when presenting business vision and strategy. Text and graph elements can be easily replaced, with an editing difficulty rated as 'moderate', offering immediate practicality for various presentation materials.
Related Products
-
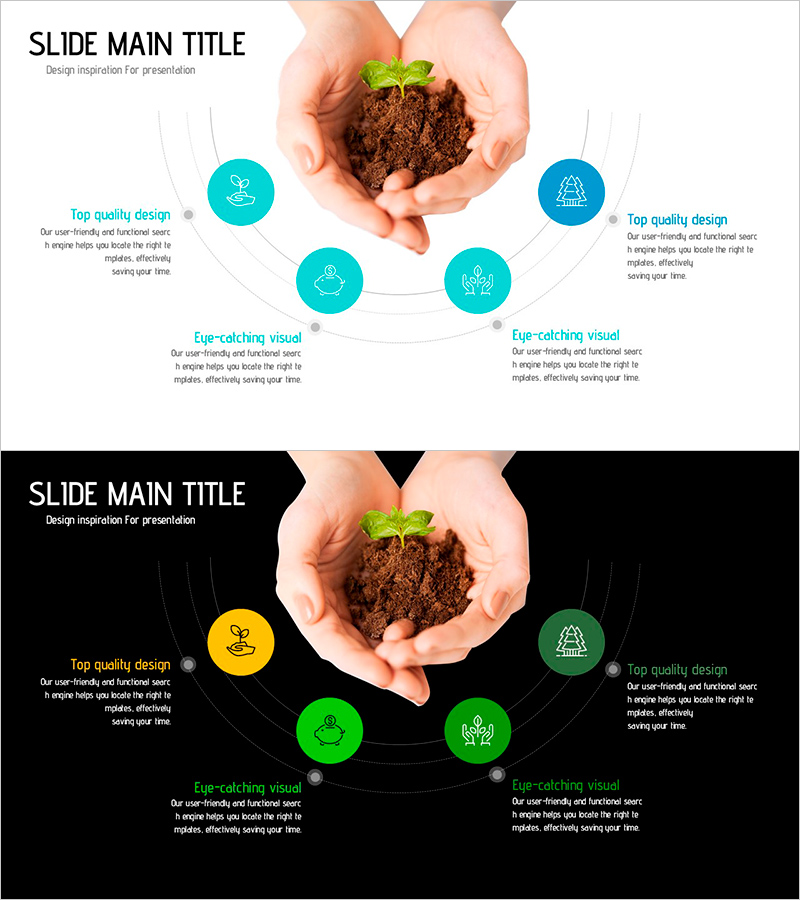
CSR Diffusion Diagram – Emphasizing Social Responsibility
#Corporate Social Responsibility #Diagram #Social Contribution Activities
-
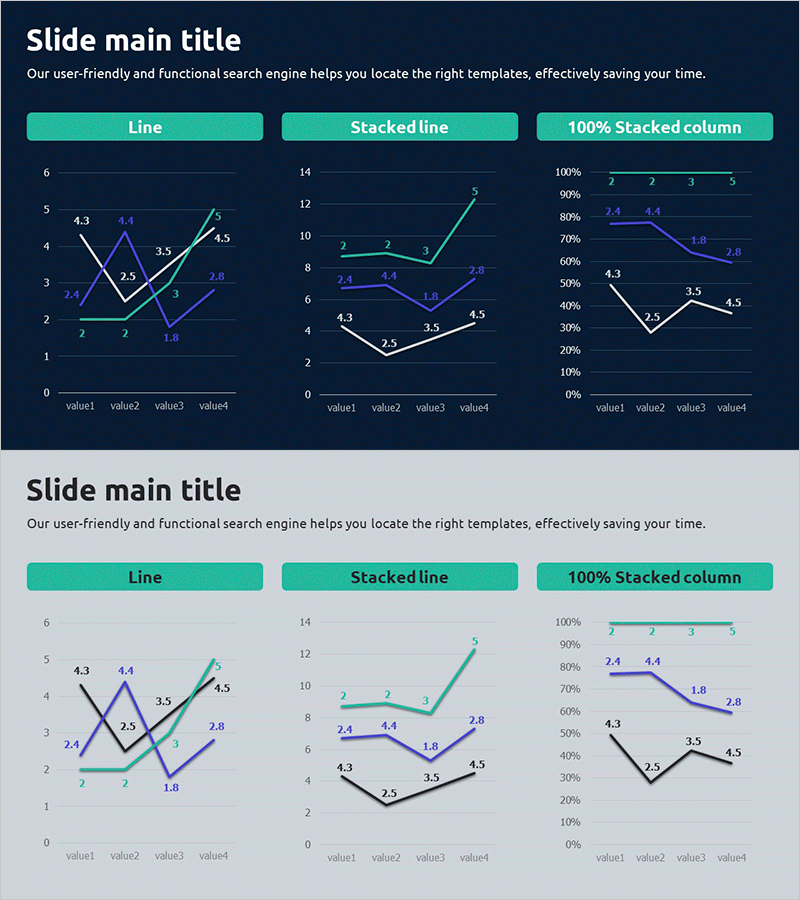
Market and Competitor Analysis Graph – A New Way to Visualize Data
#Market and Competitor Analysis #Graph #Competitor Analysis
-
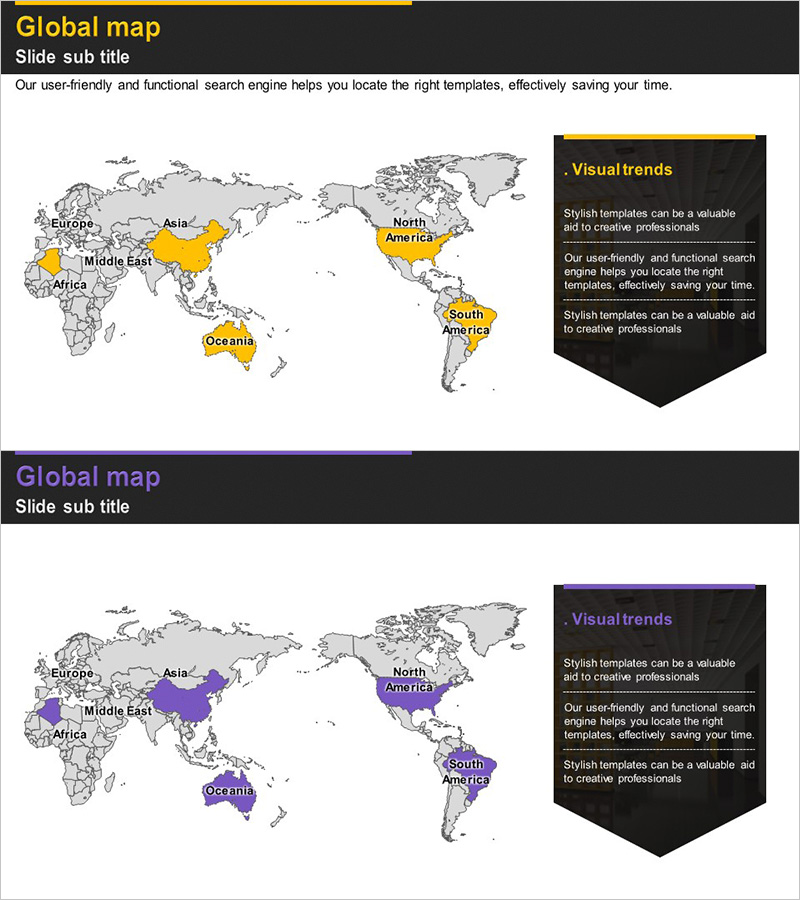
Global Target Market Analysis - Visual Trends
#Company Introduction #Market and Competitor Analysis #Other
-
Travel Guide Industry Competitor Analysis Vertical Bar Chart
#Market and Competitor Analysis #Graph #Competitor Analysis
