Business Promotion Strategy
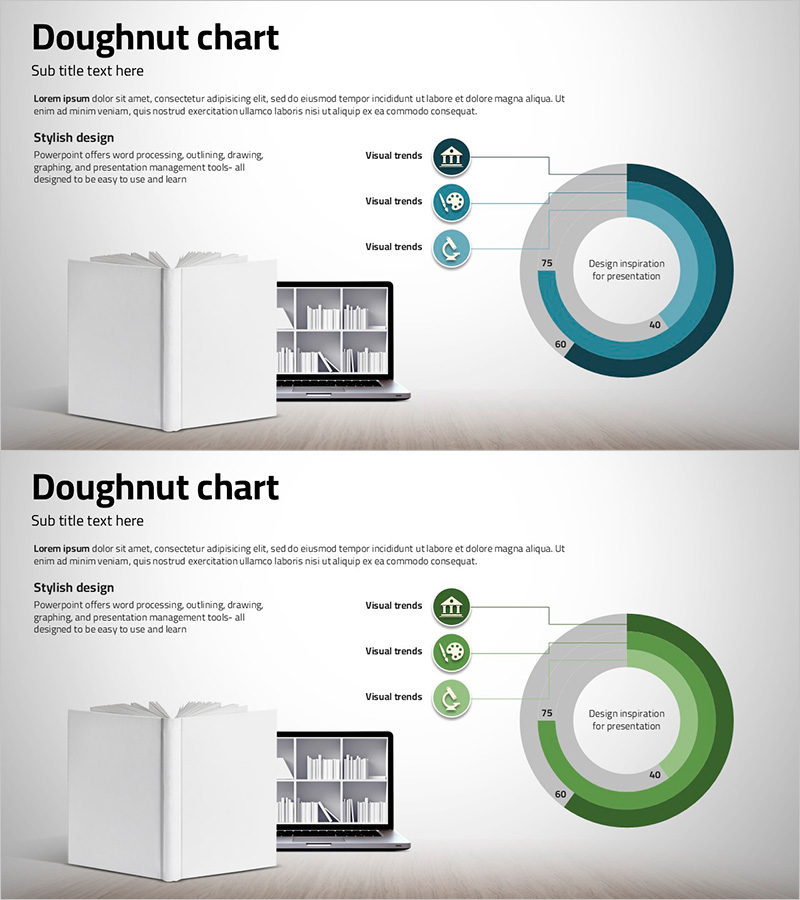
Progress Donut Chart for Each Library Service
RJ0500018_10
- Last Update 12/21/2025
- File Size 1.2MB
- # of Slides 2
- File Format PPTX
- Slide Ratio 16:9
- Color
Keywords
About the Product
This slide features a donut chart that visually represents the progress of various library services. The donut chart design is particularly effective for displaying data ratios intuitively. The main colors of blue and green convey trustworthiness and vitality, capturing the audience's attention and making it easy to communicate actual progress. This donut chart is especially useful for presentations related to business strategy and performance analysis. Text and graphic elements can be easily replaced, with an overall editing difficulty rated as 'easy'. A necessary presentation tool for improving library services and performance management.
Related Products
-
Business Target Market Analysis for Global Network
#Company Introduction #Other #Global Network
-
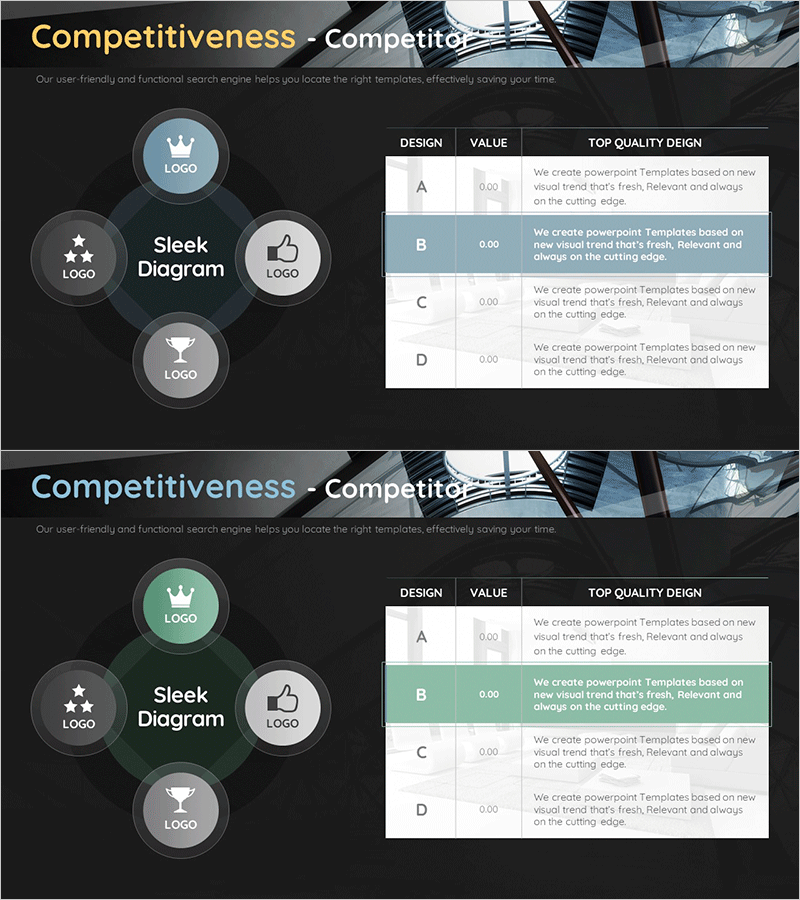
Competitive Characteristics of Differentiated Companies – Business Area and Competitor Analysis
#Business Introduction #Market and Competitor Analysis #Diagram
-
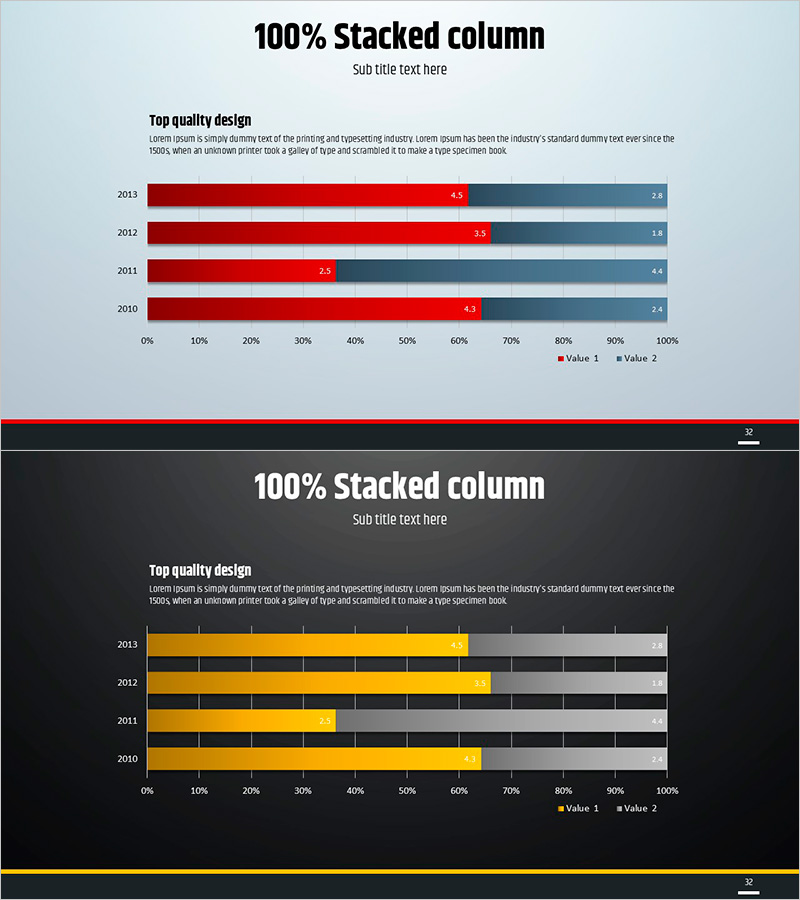
Simple Circle Template – Horizontal Segmentation Graph
#Market and Competitor Analysis #Graph #Market Status
-
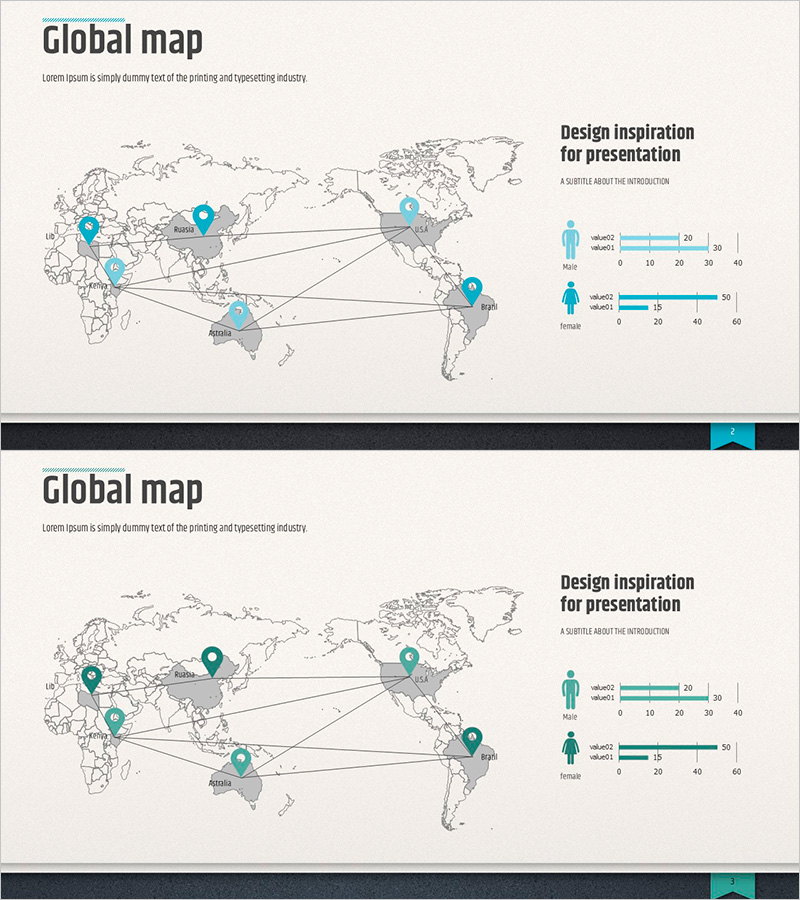
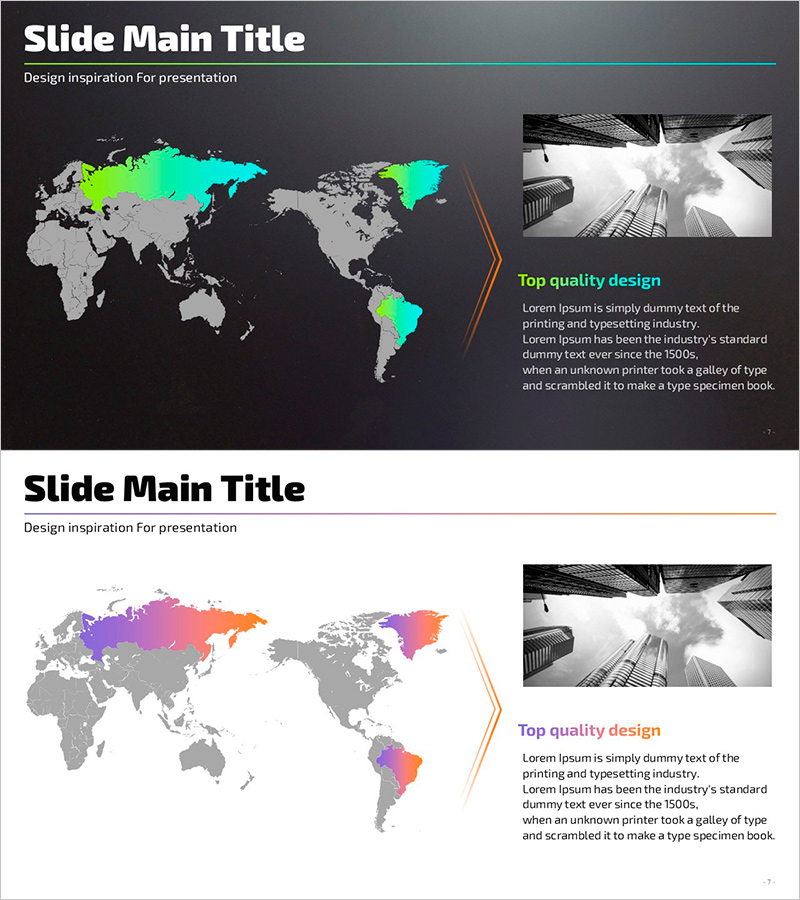
Modern Business Presentation Template Map – Global Marketing Analysis
#Market and Competitor Analysis #Marketing Plan and Strategy #Graph
