
Product/Service
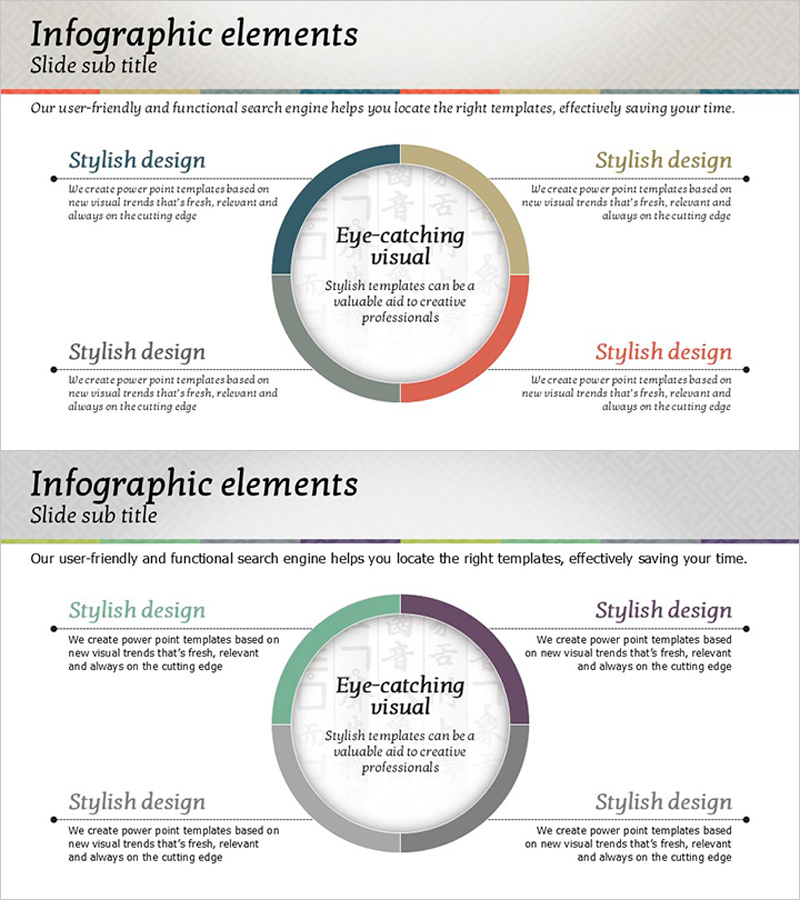
Visualizing Subjects with Donut Charts – A Master of Information Delivery
RJ0500012_17
- Last Update 12/21/2025
- File Size 0.4MB
- # of Slides 2
- File Format PPTX
- Slide Ratio 16:9
- Color
Keywords
About the Product
This slide utilizes donut charts to visually represent various subjects, creatively presenting insights through striking color contrasts and statistical data. The harmonious color blend of orange and blue emphasizes balance and focus, making it ideal for education materials, market and competitive analysis, and technology reports. Users can easily replace text and chart elements, allowing for quick modifications with an editing difficulty rated as 'easy'.
Related Products
-
Traditional Pattern Diffusion Diagram – Business Strategy and Vision
#Business Introduction #Business Vision and Strategy #Diagram
-
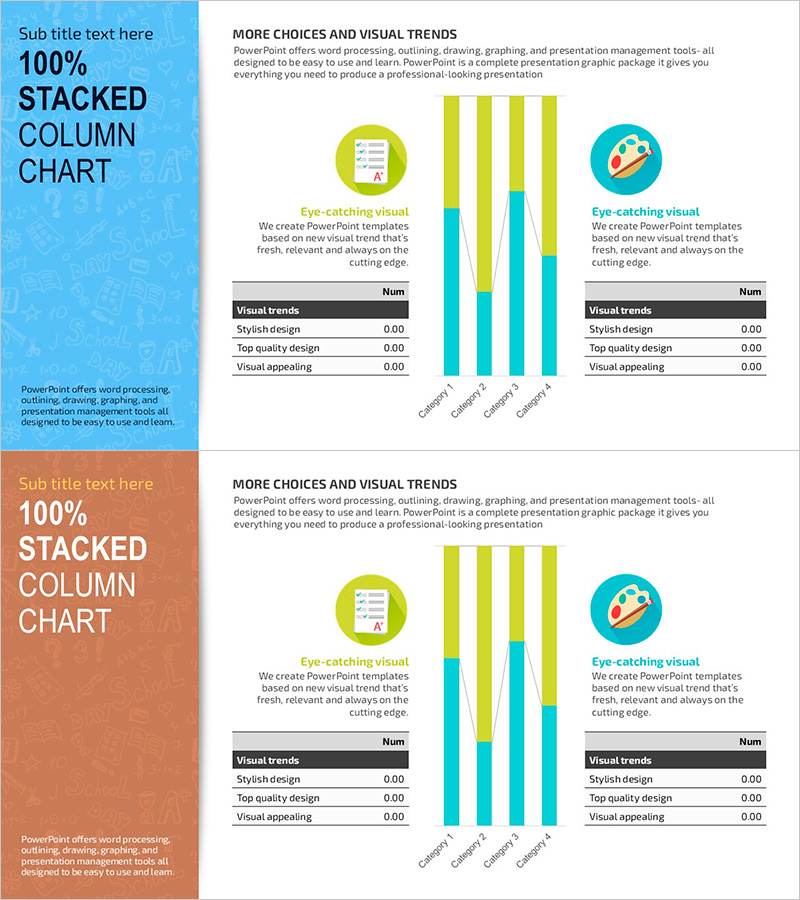
100% Stacked Column Chart by Subject – Effective Market Analysis
#Market and Competitor Analysis #Diagram #Graph
-
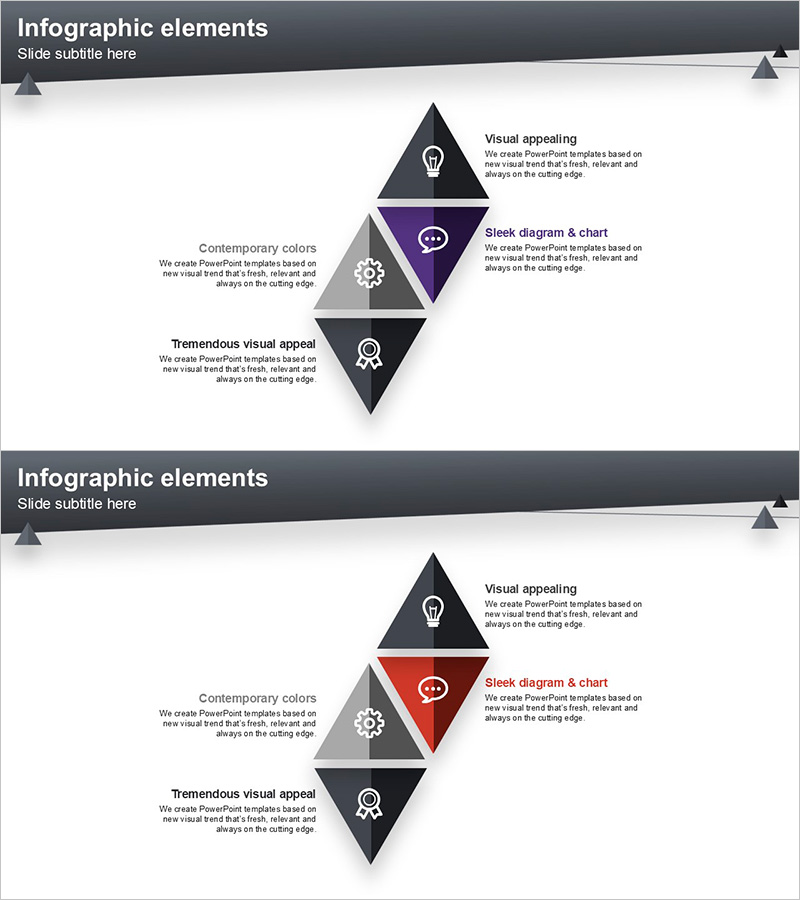
Layout Design Template – Infographic Elements
#Product/Service #Features #Benefits and Advantages
-
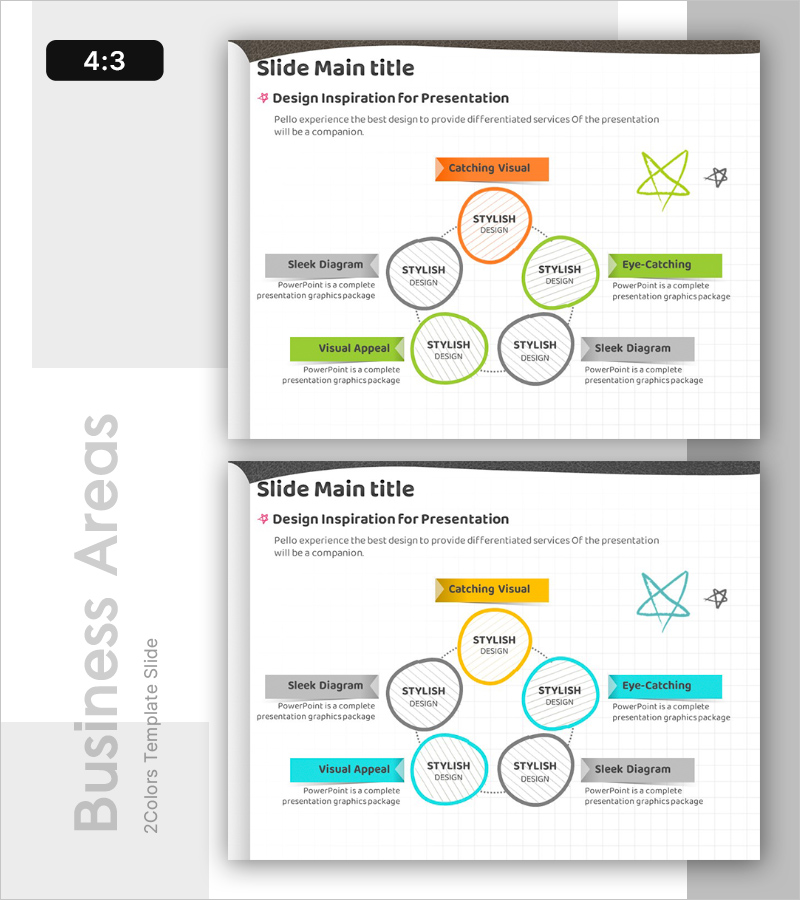
Slide Design Inspiring Presentation
#Company Introduction #Business Introduction #Diagram
