Market and Competitor Analysis
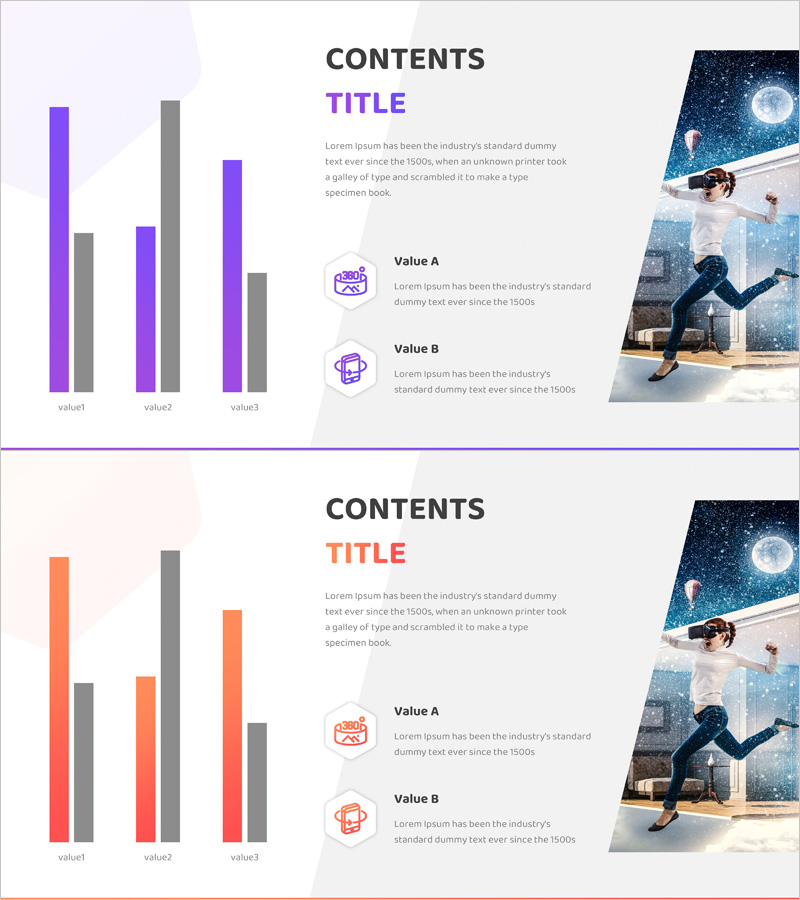
VR Market Analysis Bar Graph
RJ0400065_19
- Last Update 12/21/2025
- File Size 3.4MB
- # of Slides 2
- File Format PPTX
- Slide Ratio 16:9
- Color
Keywords
About the Product
This slide utilizes a horizontal bar graph optimized for analyzing the VR market, visually representing data effectively. The harmonious color scheme of purple and orange catches the audience's attention, making it ideal for analyzing market conditions and competitors through easy comparisons. The design adopts a cluster structure that facilitates straightforward data comparison, with a moderate editing difficulty, allowing practitioners to quickly and easily utilize it.
Related Products
-
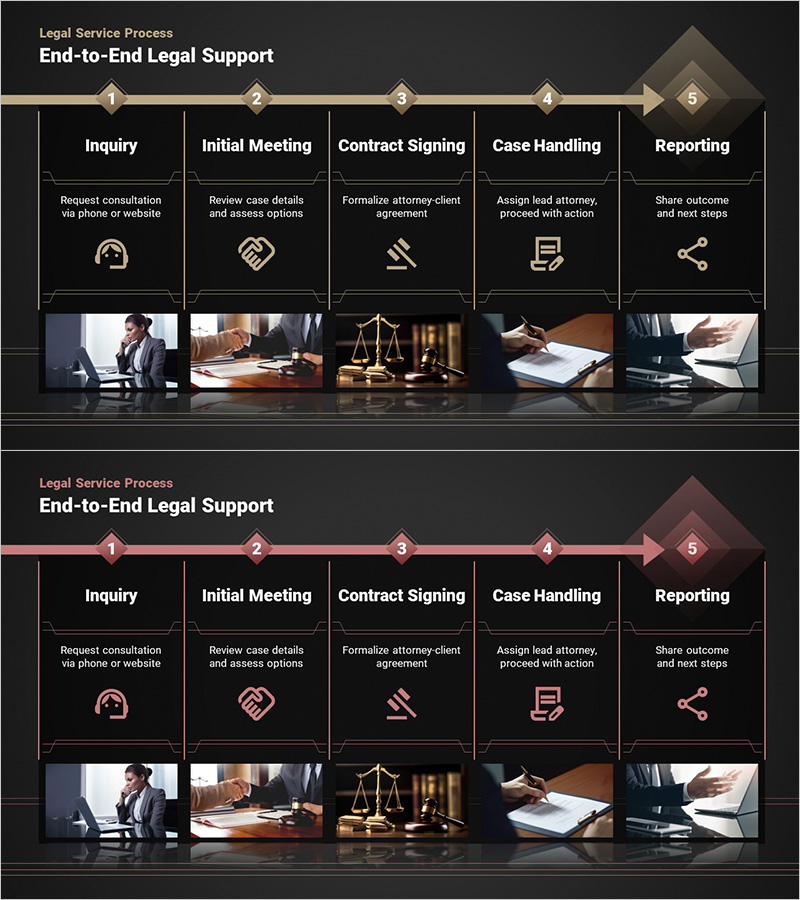
Service Process: From Inquiry to Outcome – Generation Z and Game & Empathy Mechanisms
#Operation Plan #Diagram #Business Processes
-
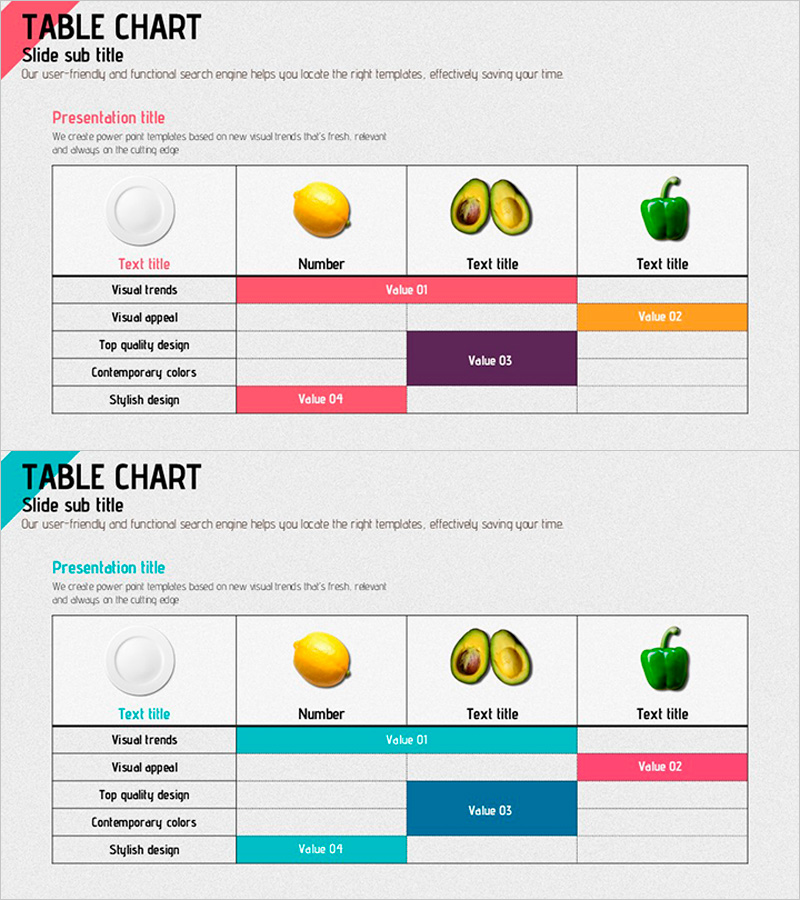
Color Table Chart – Effective Data Visualization
#Diagram
-

Yellow Green Income Statement Table – Efficient Financial Analysis
#Financial Plans and Performance #Diagram #Balance Sheet
-
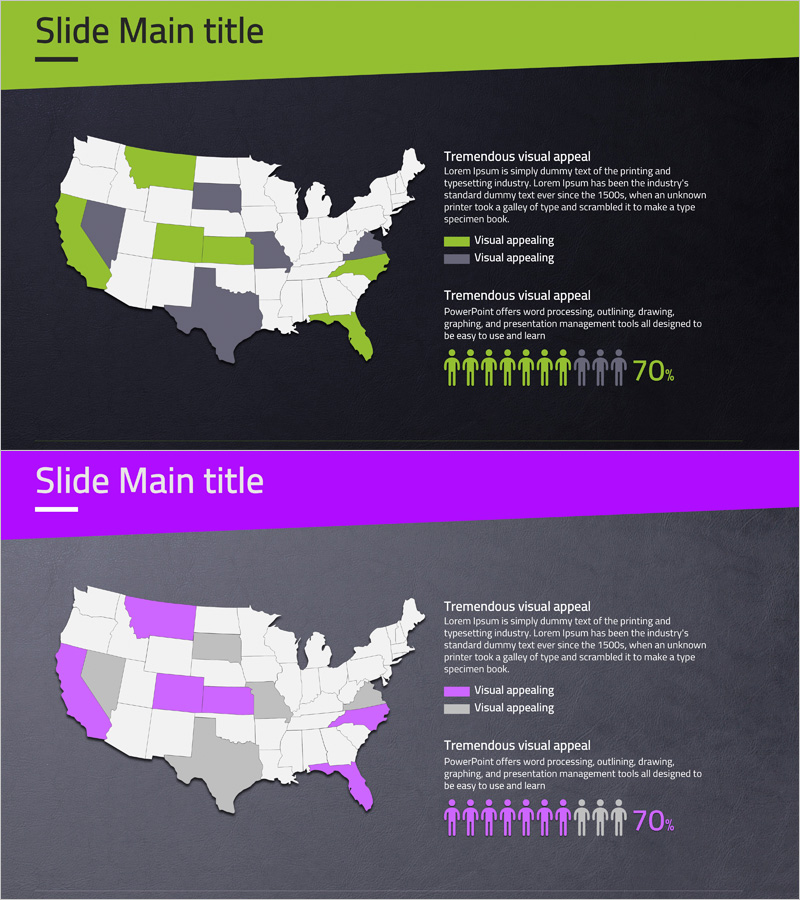
Analysis of US Target Region Users – In-Depth Visualization
#Market and Competitor Analysis #Marketing Plan and Strategy #Graph
