Company Introduction
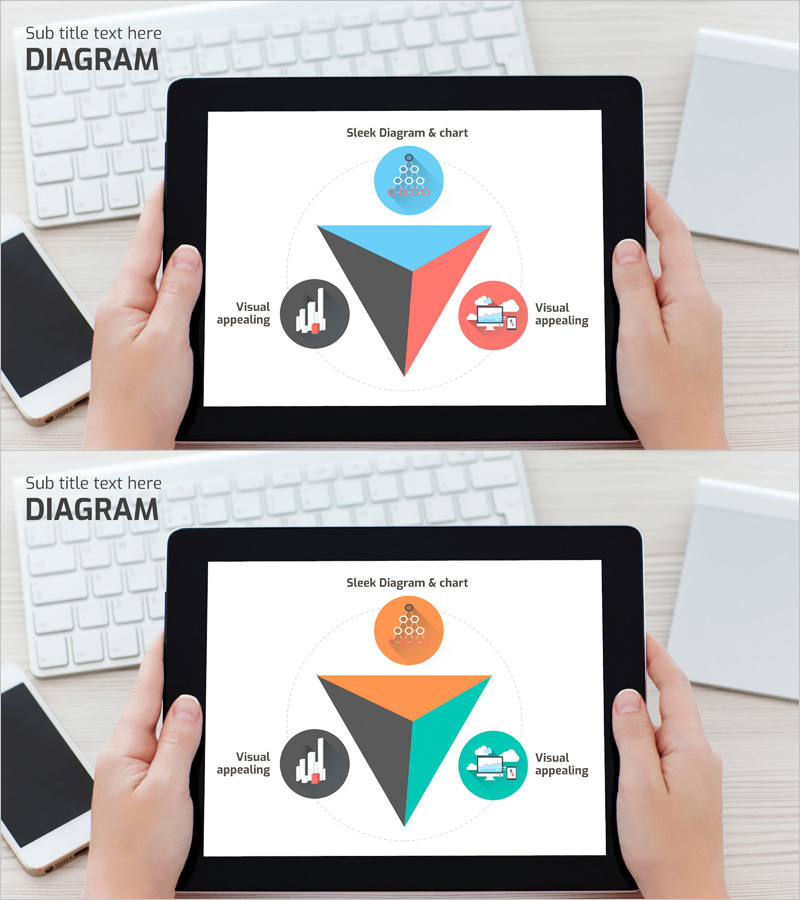
Big Data Domain Triangle Diagram
RJ0400053_29
- Last Update 12/21/2025
- File Size 1.7MB
- # of Slides 2
- File Format PPTX
- Slide Ratio 16:9
- Color
Keywords
About the Product
This slide provides a triangle diagram that effectively visualizes various domains of Big Data. Built on a modern and sleek design, it clearly delineates each area, making it ideal for business reports and presentations to convey information effectively. With blue and orange as the primary colors, it enhances visual appeal. Perfectly optimized for business presentations, project introductions, and educational materials.
Related Products
-
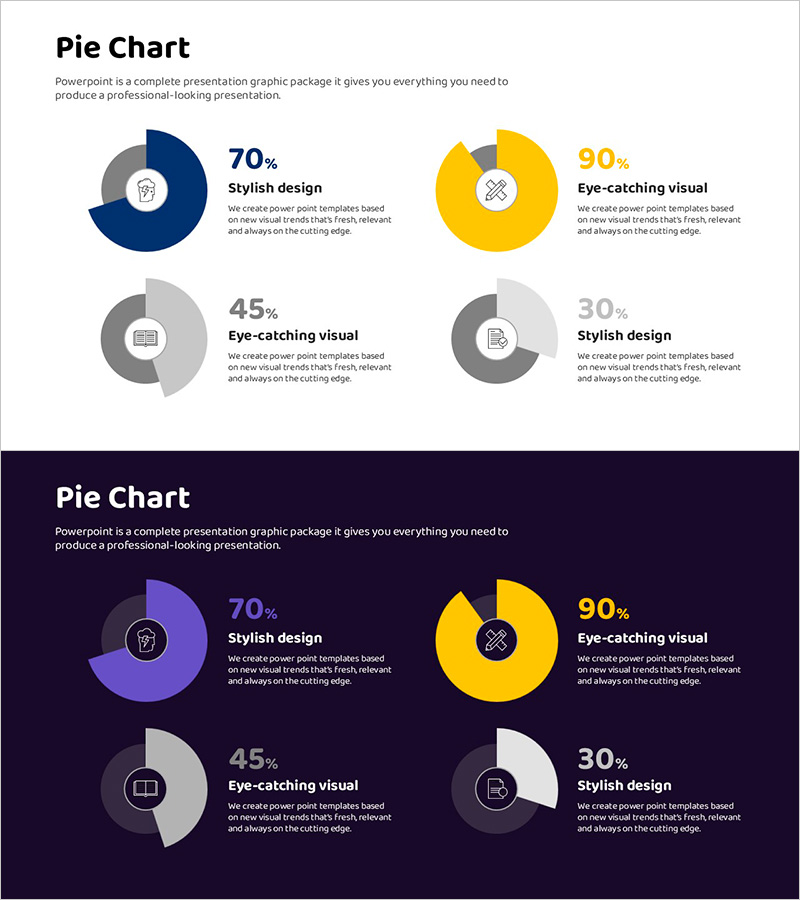
Donut Charts in 4 Fields – Effective Performance Visualization
#Company Introduction #Product/Service #Graph
-
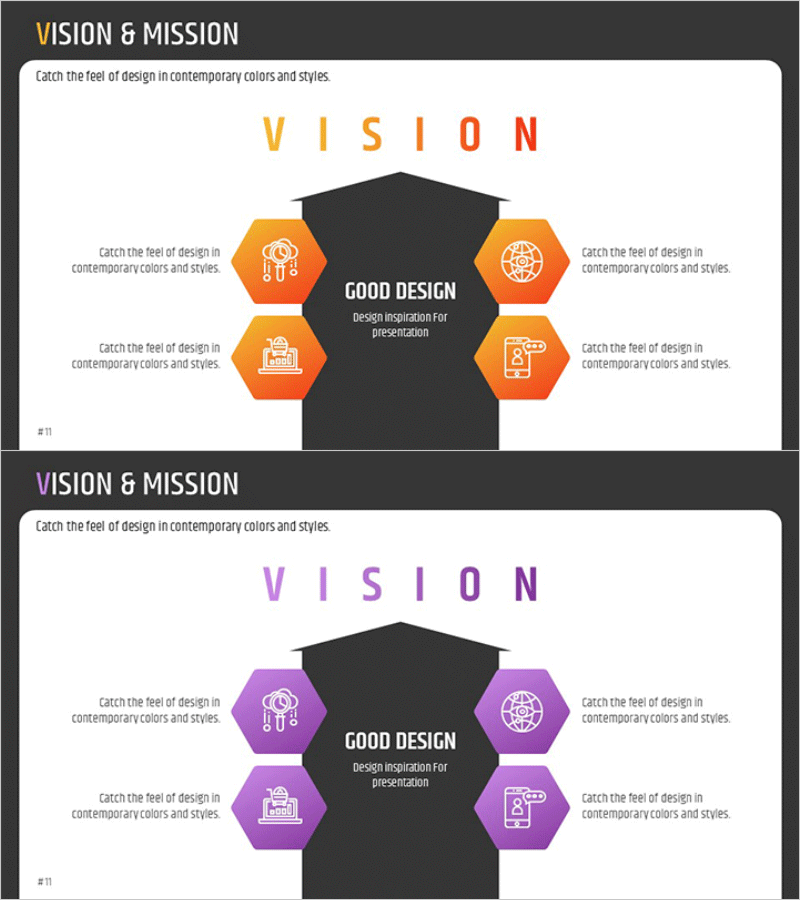
Future-oriented Vision and Mission Slide
#Company Introduction #Product/Service #Diagram
-

Construction Project Fund Management Plan – Designing Financial Plans and Performance
#Financial Plans and Performance #Diagram #Capital Requirement Plan
-
Effects of Electricity Saving Practices – Effective Business Strategy Presentation
#Business Vision and Strategy #Diagram #Business Strategy
