Financial Plans and Performance
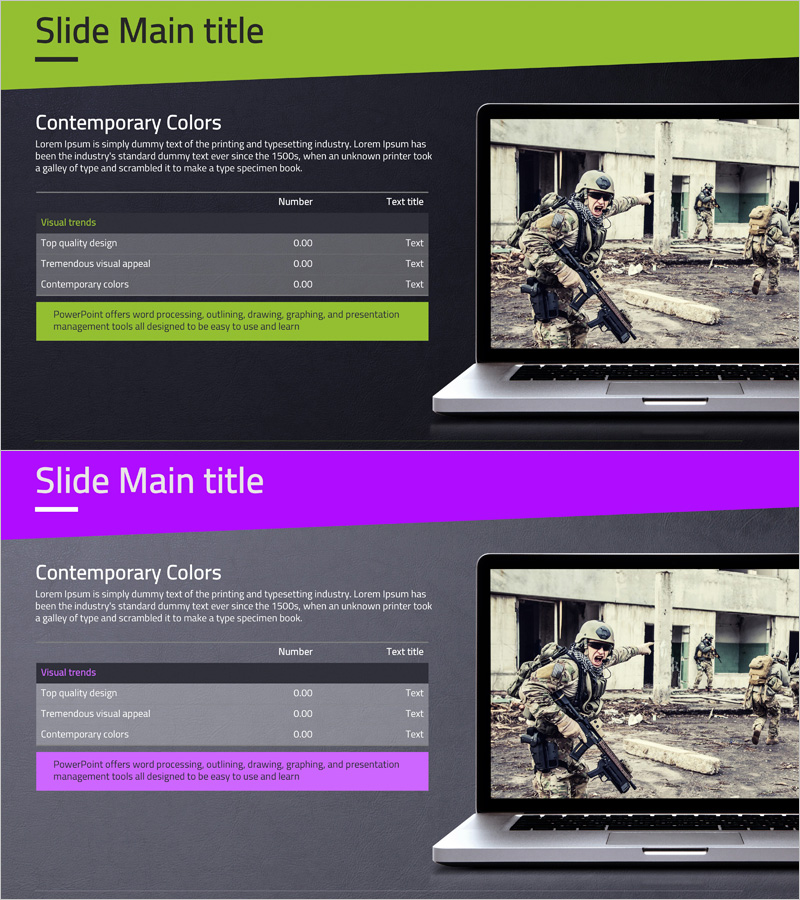
PC Game Sales and Revenue Table – Visualizing Financial Performance
RJ0400052_20
- Last Update 12/21/2025
- File Size 10.1MB
- # of Slides 2
- File Format PPTX
- Slide Ratio 16:9
- Color
Keywords
About the Product
This slide features a profit and loss table designed to intuitively convey the sales and revenue of PC games. With a bold black and gray background, it enhances the professional image and visual impact while clearly representing sales flow and revenue structure. It is particularly suitable for business investment analysis, industry reports, and profitability assessments. The editing difficulty is rated 'moderate', allowing for easy replacement of data and text, making it practical for immediate use in real-world situations.
Related Products
-

Observation Status Analysis Graph – Market and Competitor Analysis
#Market and Competitor Analysis #Diagram #Graph
-
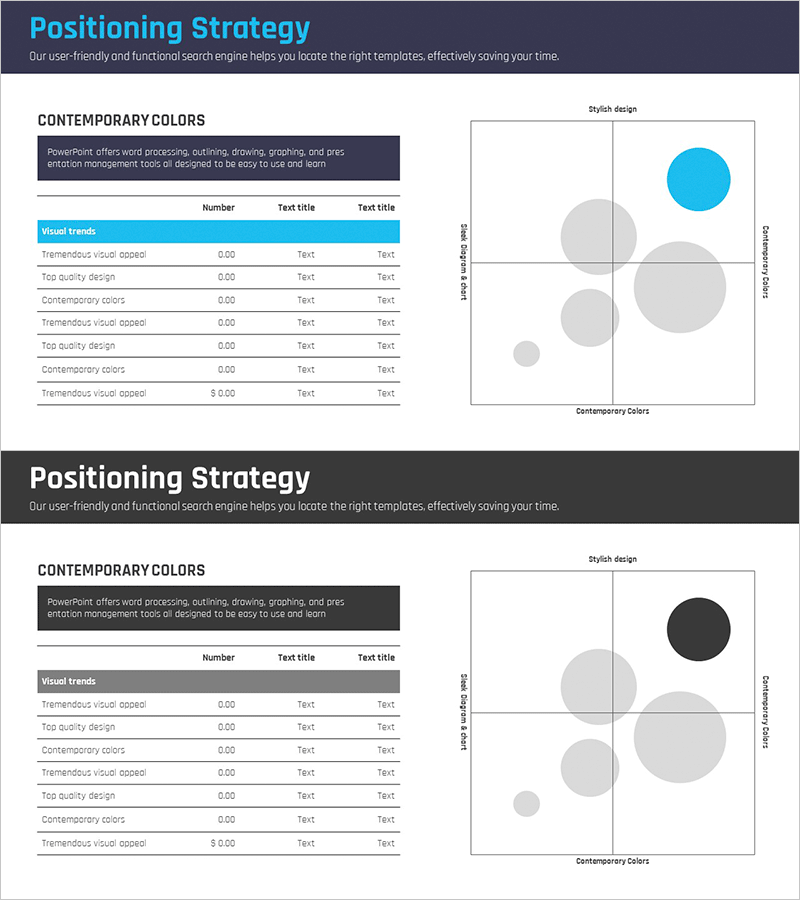
Market Distribution Analysis Positioning Map – Strengthening Competitiveness
#Market and Competitor Analysis #Marketing Plan and Strategy #Diagram
-

Visualization of Marine Life Path – Business Strategy
#Business Promotion Strategy #Other #Business Direction
-

Flower Wide PPT Closed Diagrams – Clarifying Business Vision and Goals
#Business Vision and Strategy #Diagram #Business Goals
