Financial Plans and Performance
Visualizing Key Financial Indicators with Diagram Presentation
RJ0400050_23
- Last Update 12/21/2025
- File Size 2MB
- # of Slides 2
- File Format PPTX
- Slide Ratio 16:9
- Color
Keywords
About the Product
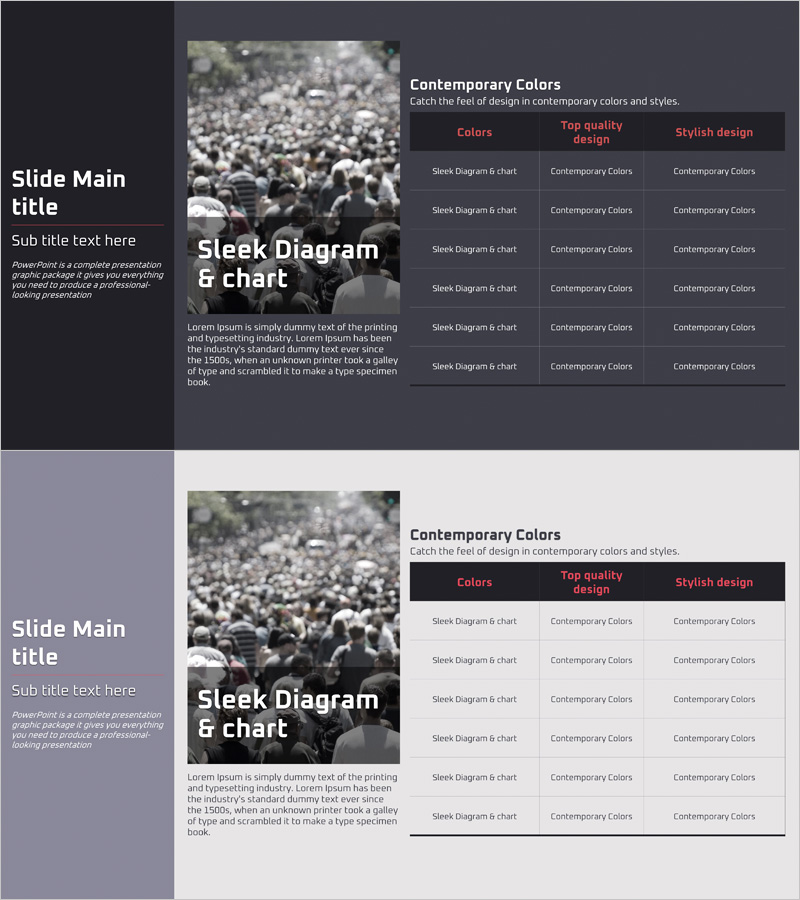
This slide features a PowerPoint template designed to effectively convey key financial indicators with a combination of tables and diagrams. Using black and gray as the main colors, it emphasizes visual sophistication. The layout optimizes information delivery, making it ideal for business presentations, investor discussions, or financial reports. With an engaging design that captures the audience's attention, it has a moderate editing difficulty, allowing for easy text and data replacement for various presentation scenarios.
Related Products
-
Business Goals Connection Diagram – Linking Objectives and Vision
#Business Vision and Strategy #Marketing Plan and Strategy #Diagram
-

Medical Seminar Today's Speaker Profile
#Company Introduction #Diagram #Introduction of Executives
-

Efficient Running Posture – Analysis of Exercise Trends
#Product/Service #Business Vision and Strategy #Diagram
-
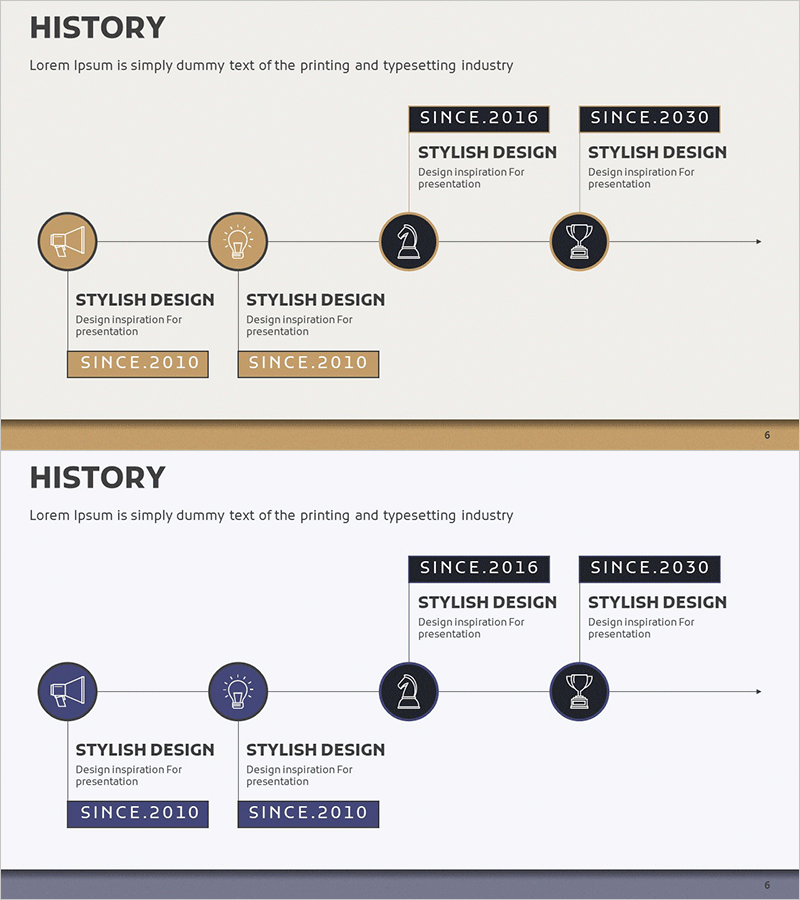
Company History Diagram – Capturing the Flow of Development
#Company Introduction #Diagram #History
