
Company Introduction
Donut Chart for IT Industry
RJ0400041_9
- Last Update 12/21/2025
- File Size 0.2MB
- # of Slides 2
- File Format PPTX
- Slide Ratio 16:9
- Color
Keywords
About the Product
This slide visualizes data from the IT industry using a donut chart, providing clear and intuitive information representation. Each segment illustrates various business areas, and the non-central design allows flexible data representation. The main colors, blue and orange, convey professionalism and vitality simultaneously. This slide is ideal for IT-related presentations, report writing, and strategic meetings. It features replaceable elements and low editing difficulty, enabling easy customization for everyone.
Related Products
-
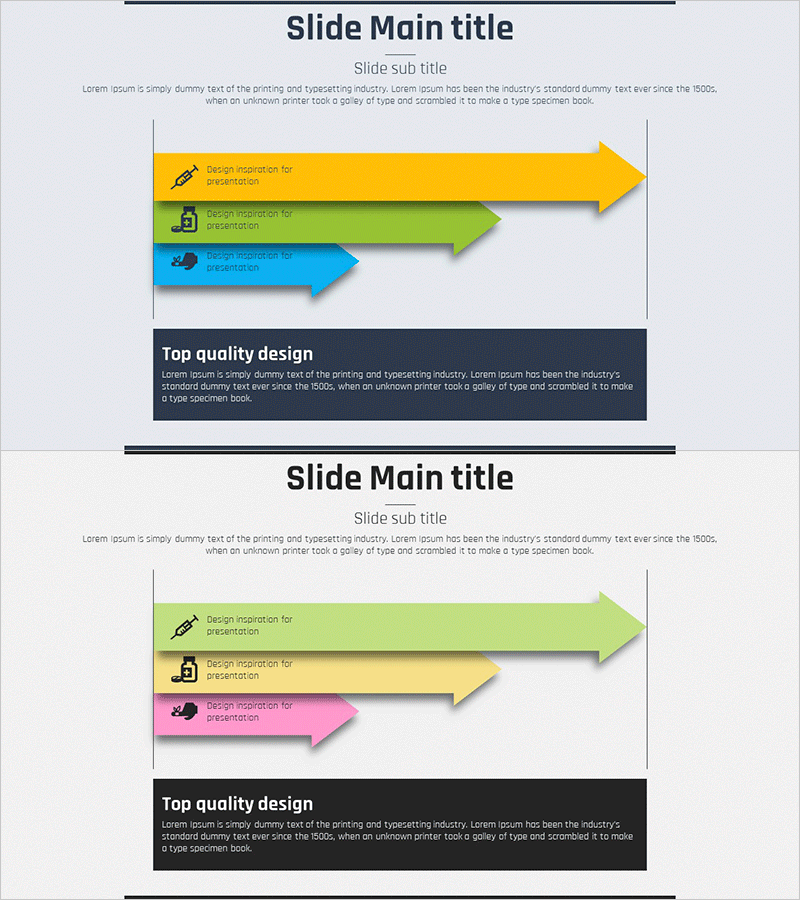
Medical Schedule Planning Arrow Diagram
#Business Promotion Strategy #Diagram #Phase-wise Schedule Plan
-
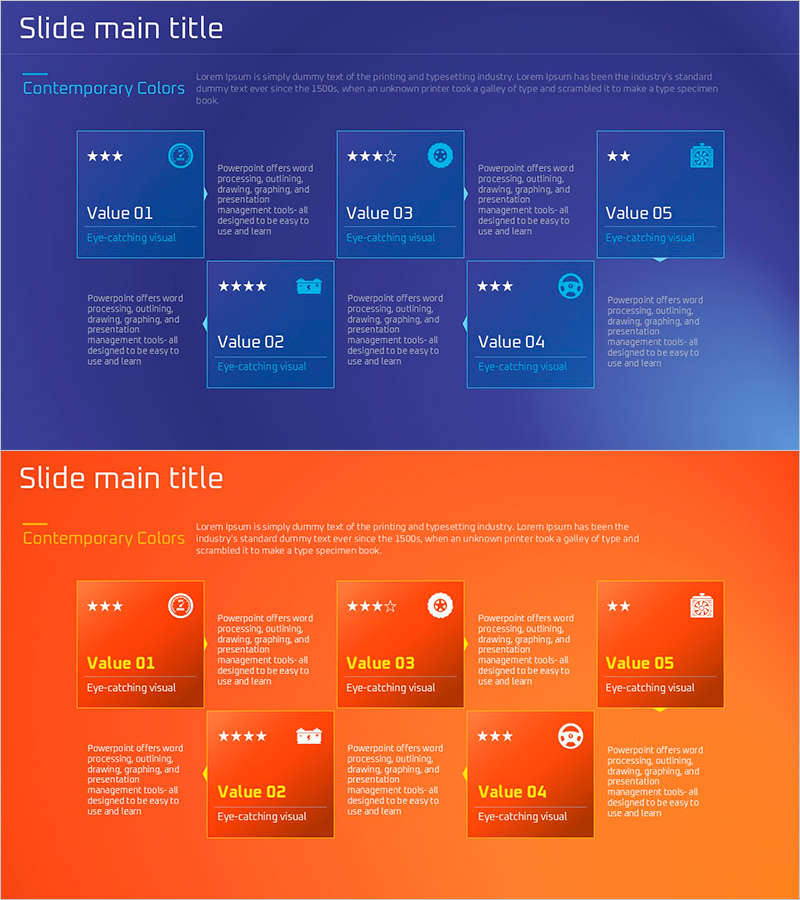
Product Satisfaction Assessment Box – Listening to Customer Voices
#Operation Plan #Customer Success Stories #Diagram
-
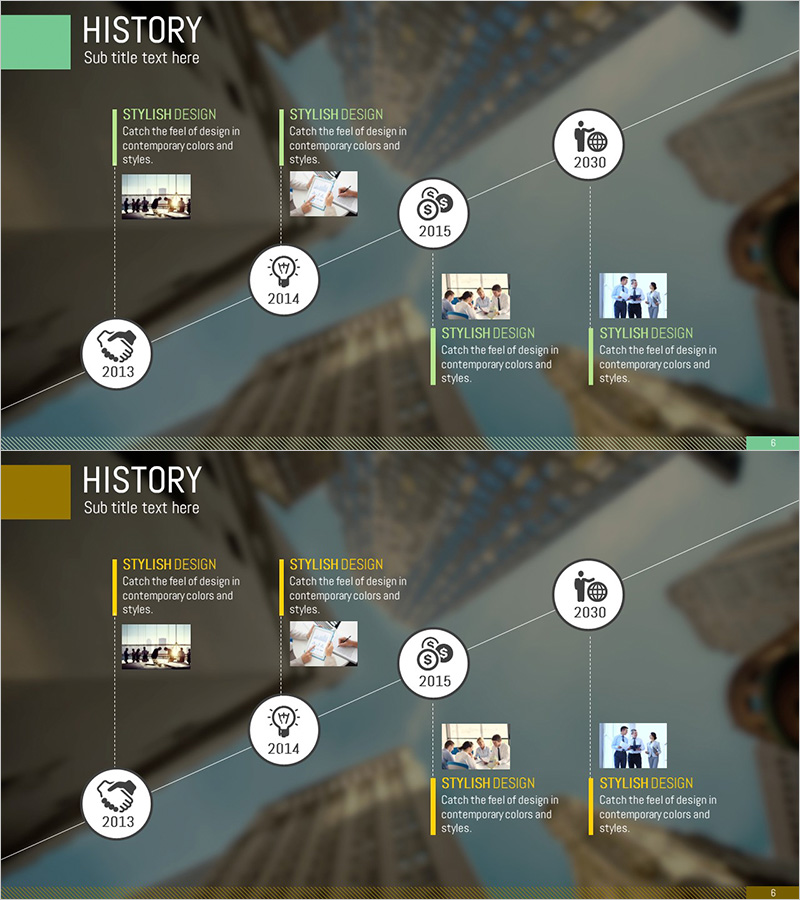
Business History Diagram – Cluster Visualization
#Company Introduction #Diagram #History
-

Diagram Slide for Understanding the Medical Industry
#Company Introduction #Business Introduction #Diagram
