Product/Service
Visualizing Product Introduction with App Icon Graph – Innovation and Trends
RJ0400041_11
- Last Update 12/21/2025
- File Size 0.2MB
- # of Slides 2
- File Format PPTX
- Slide Ratio 16:9
- Color
Keywords
About the Product
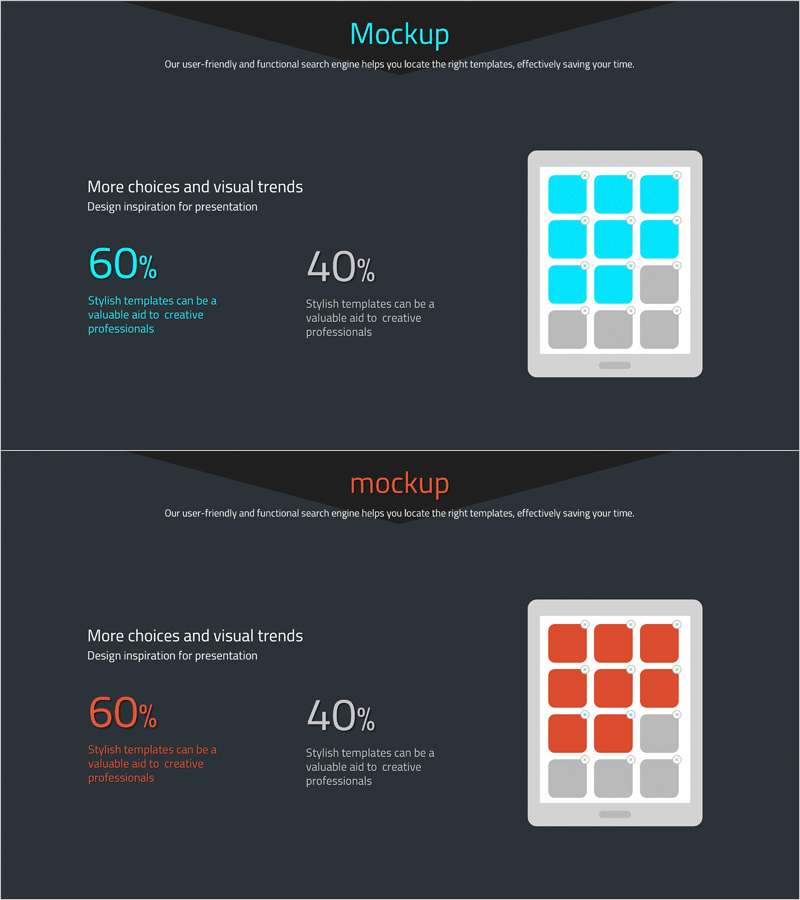
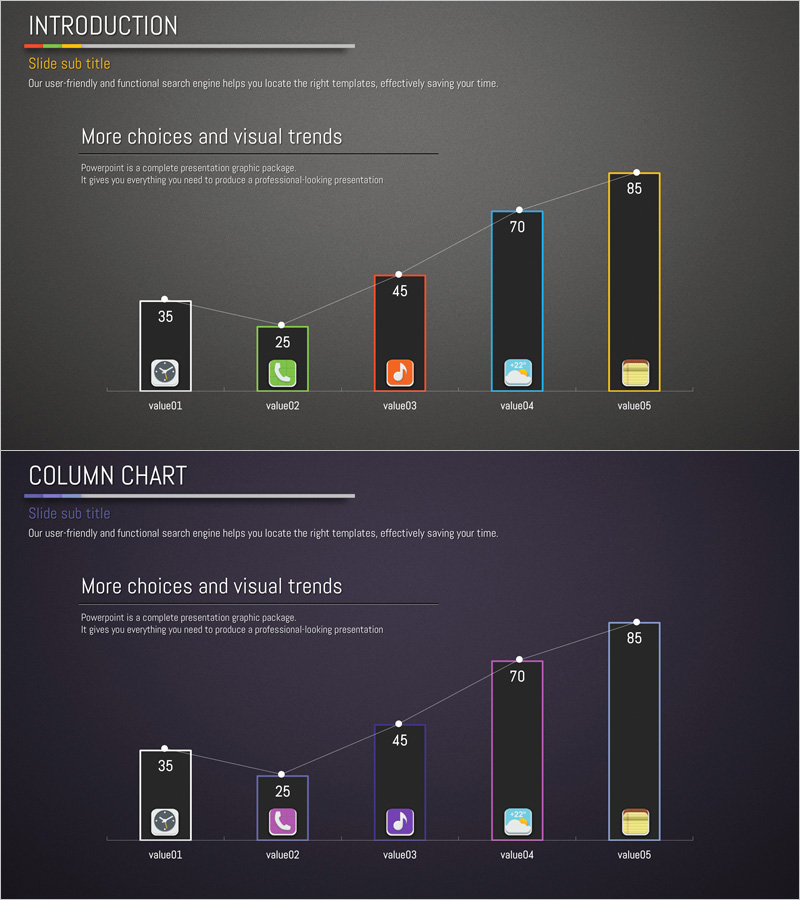
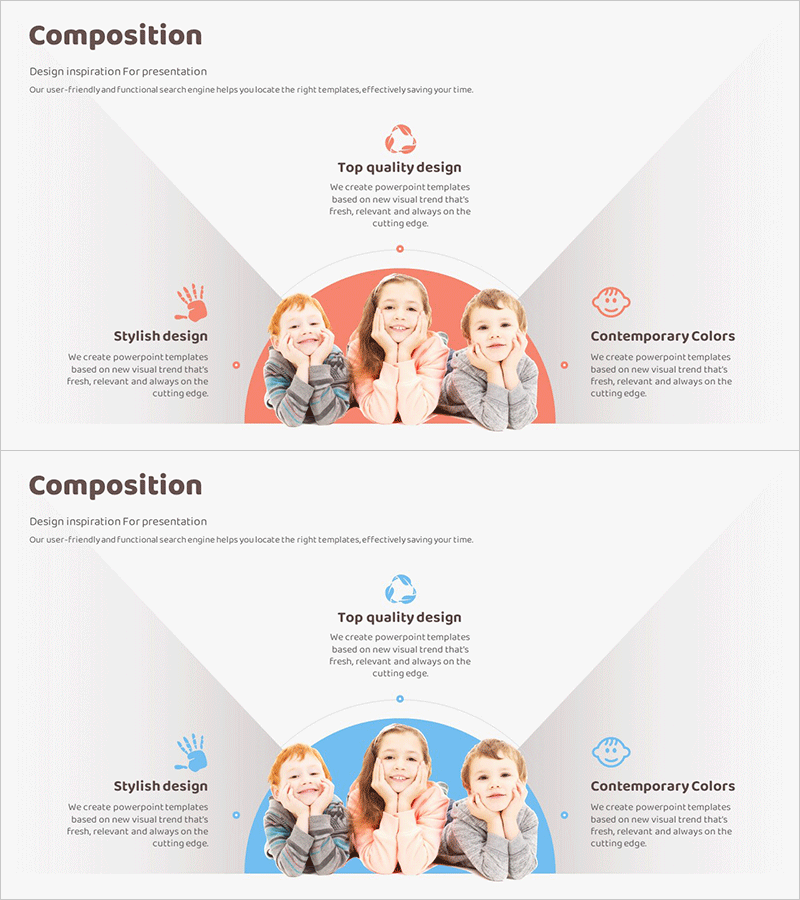
This slide utilizes an app icon graph to visually represent the development status of products and services. With a sleek design featuring blue and orange as primary colors, it attracts attention while enabling clear data comparison. Ideal for presenting product details, development status, and technological trends, this slide is effective for educational and business meetings. It allows for easy replacement of text and graphs, rated as 'easy' in editing difficulty, making it quickly applicable in various scenarios.
Related Products
-
Diagram Slide for Exploring Natural Scenery
#Slide Type #Product/Service #Diagram
-
Product Service Introduction Diagram – Effective Communication
#Product/Service #Diagram #Product/Service Introduction
-
Usage Status and Trends by Application Graph - Horizontal & Vertical Bar Utilization
#Business Introduction #Market and Competitor Analysis #Graph
-
Baby Products Business Components Slide - Cluster Diagram Design
#Product/Service #Diagram #Composition
