Company Introduction
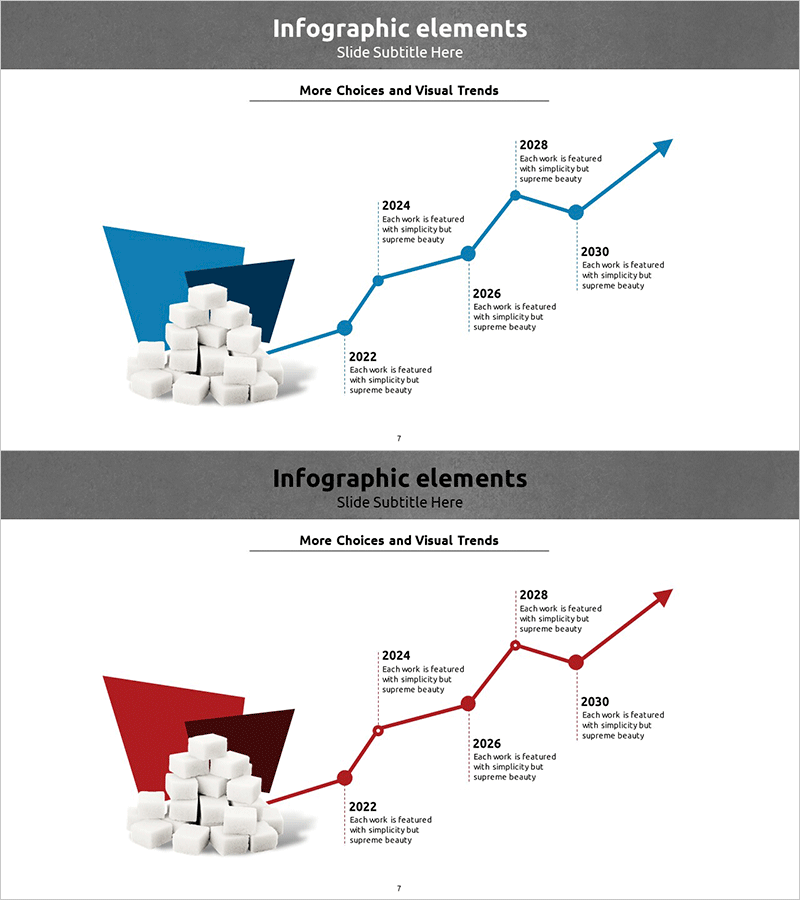
Line Graph of Sugar Intake by Year – Market Trends and Future
RJ0400034_6
- Last Update 12/21/2025
- File Size 2.7MB
- # of Slides 2
- File Format PPTX
- Slide Ratio 16:9
- Color
Keywords
About the Product
This slide features a line graph visually analyzing the changes in sugar intake by year. With its intuitive design, it allows easy comprehension of annual changes and trends, using a striking combination of blue and red. This slide is highly suitable for various business presentations, including market and competition analysis, as well as historical presentations. Text and data are easily replaceable, with a low level of editing difficulty for quick application.
Related Products
-
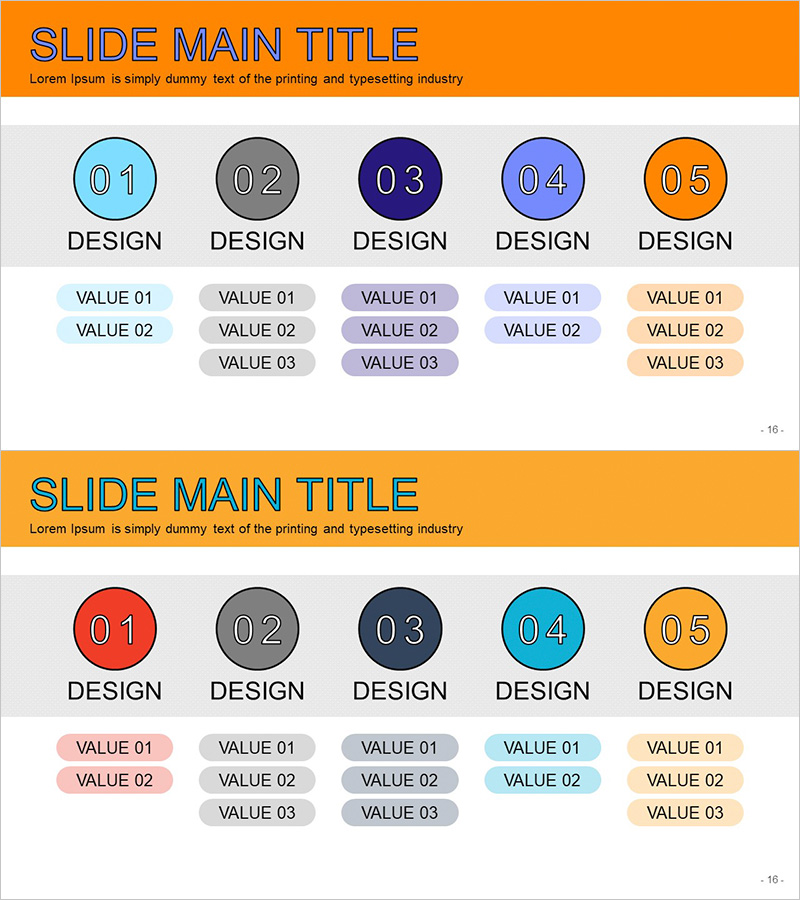
Business Objectives Table of Contents – Visualizing Business Strategy
#Business Vision and Strategy #Marketing Plan and Strategy #Diagram
-
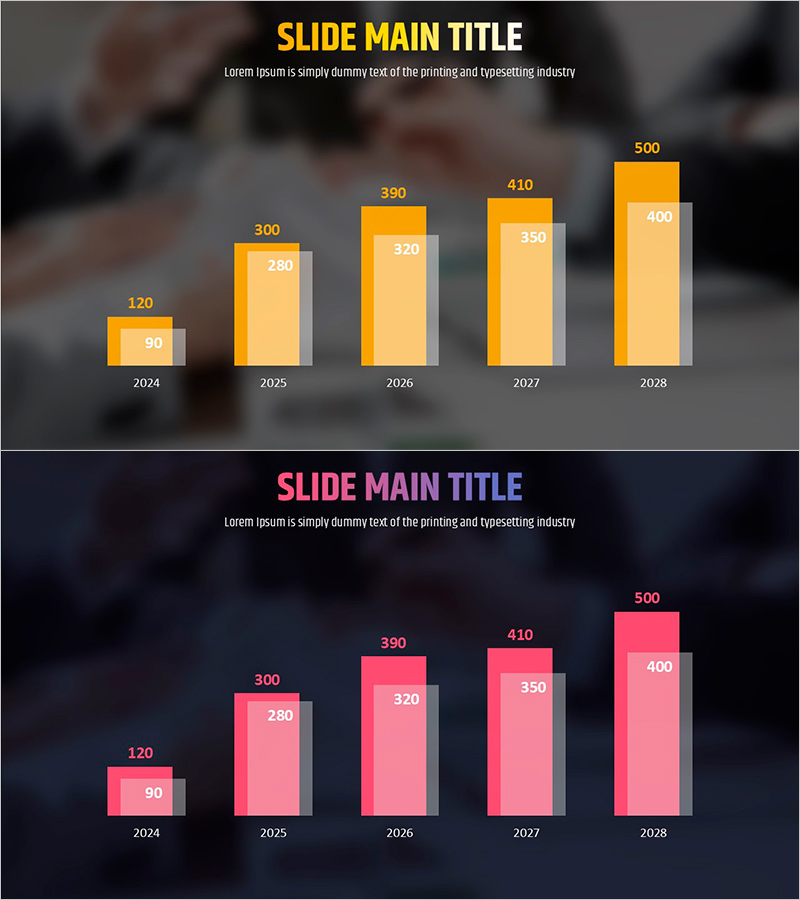
Yellow Pink Growth Comparison Graph
#Graph
-
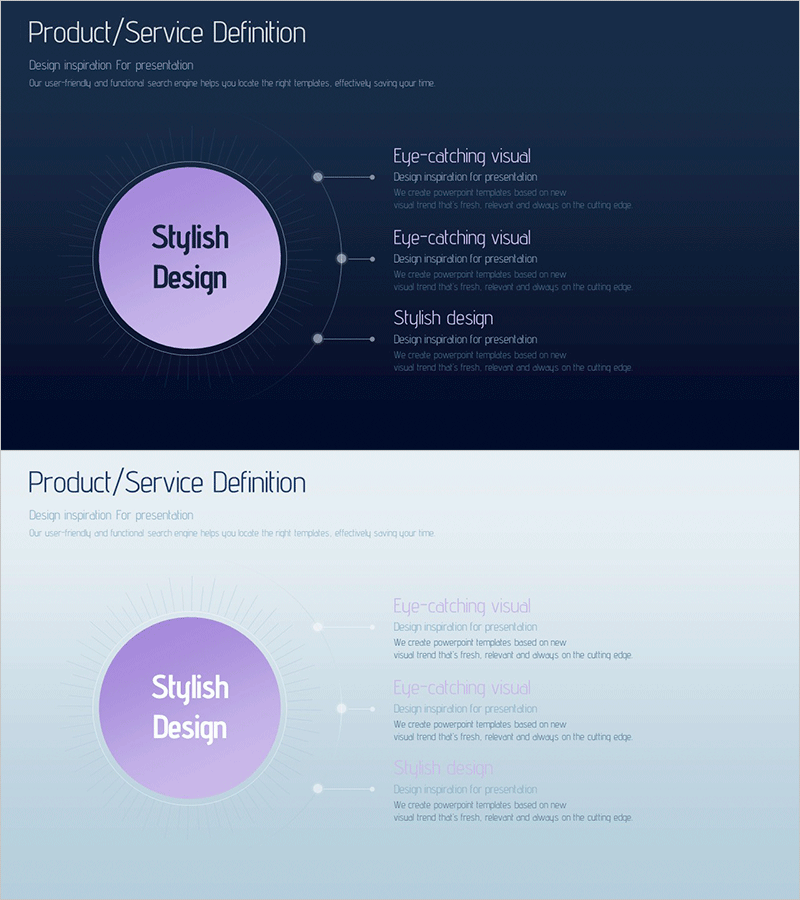
Product Service Overview – Diverging Diagram
#Product/Service #Diagram #Graph
-

Introducing the Business Team – Sleek and Contemporary Diagram
#Company Introduction #Diagram #Manpower
