
Other
Business Performance Visualization Infographic Slide – Key to Success
RJ0300076_31
- Last Update 12/21/2025
- File Size 0.1MB
- # of Slides 2
- File Format PPTX
- Slide Ratio 16:9
- Color
Keywords
About the Product
This single slide features an infographic design to visually represent business performance. It includes graphs highlighting growth trends and various symbolized icons, making it highly valuable for business development, marketing strategies, and investment proposals. Users can maximize the impact of showcasing key data swiftly and effectively. Centered around digital logos and imagery of revenue increase, it encapsulates the theme of 'Key to Success'. Text and graphic element replacements are easy, with an overall editing difficulty rated as 'easy', allowing for rapid integration into various presentations.
Related Products
-
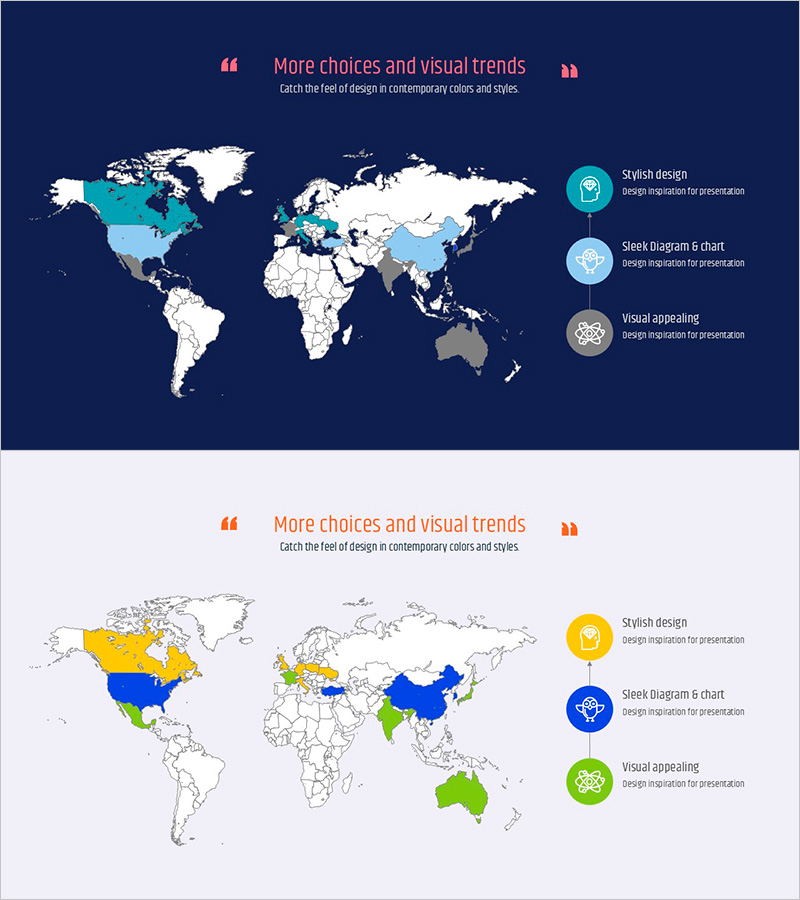
Scientific and Technological Development Countries Map – Market Analysis and Competitor Insights
#Market and Competitor Analysis #Other #Market Analysis
-
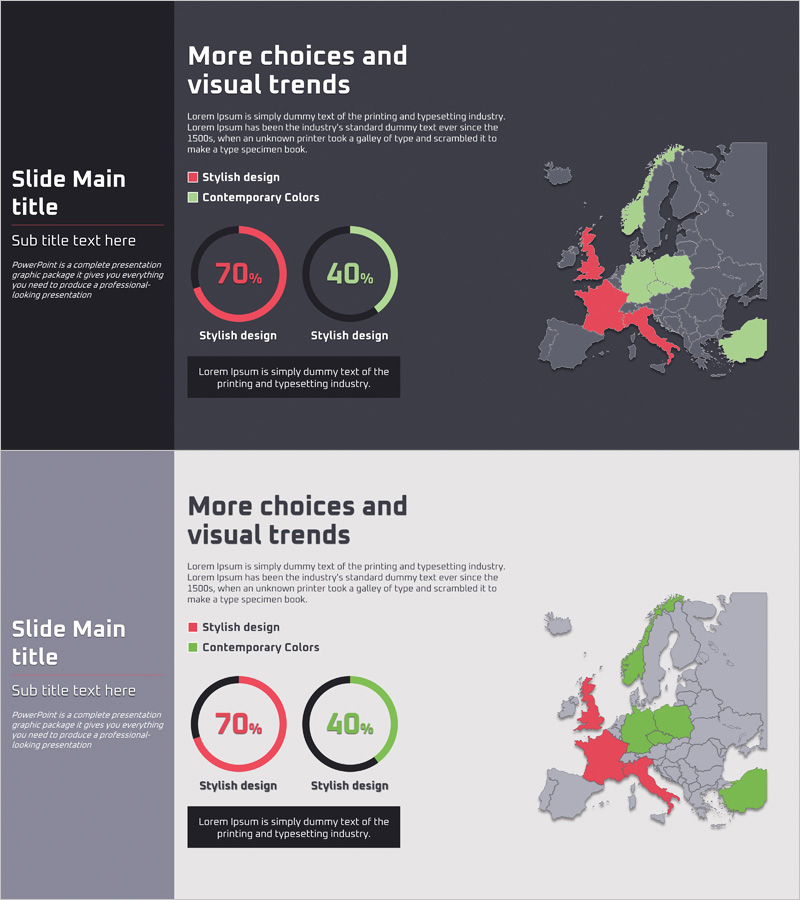
European Market Share Analysis Graph
#Market and Competitor Analysis #Marketing Plan and Strategy #Graph
-
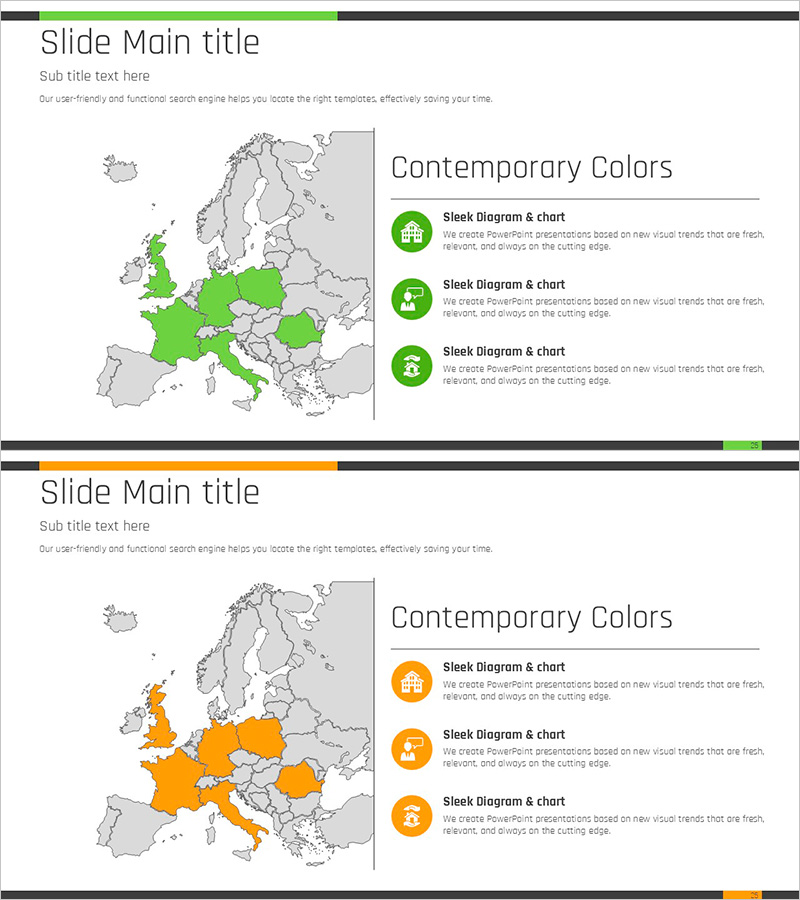
Orange Green Target Market Survey – Visual Market Analysis Design
#Market and Competitor Analysis #Other #Target Market
-
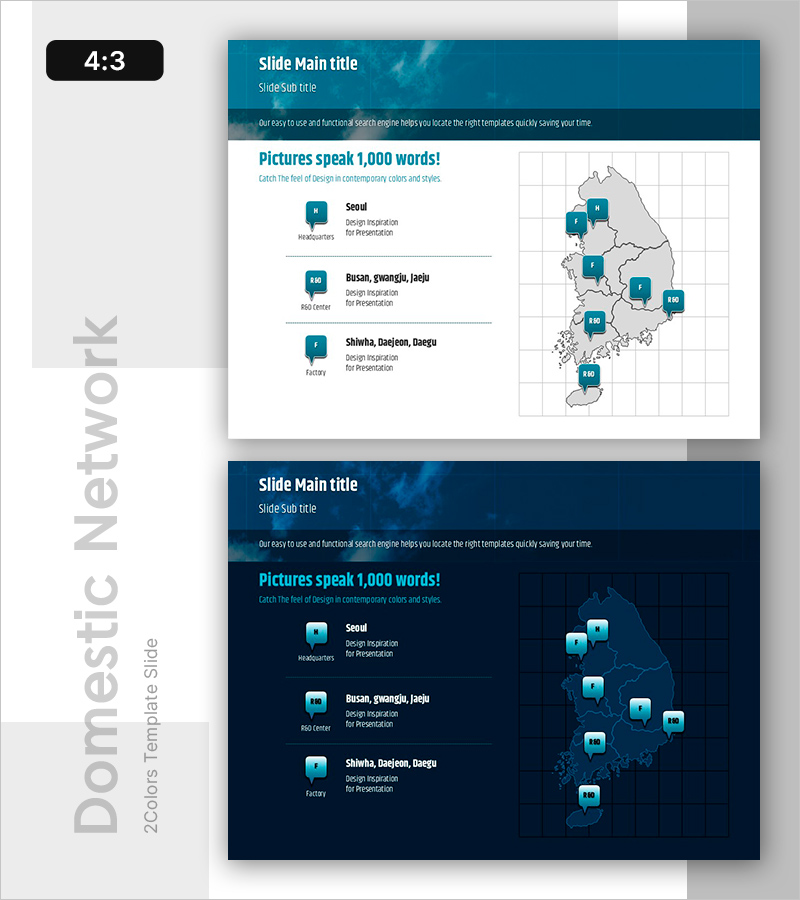
Key Locations with Speech Bubble Indicators
#Company Introduction #Product/Service #Other
