Company Introduction
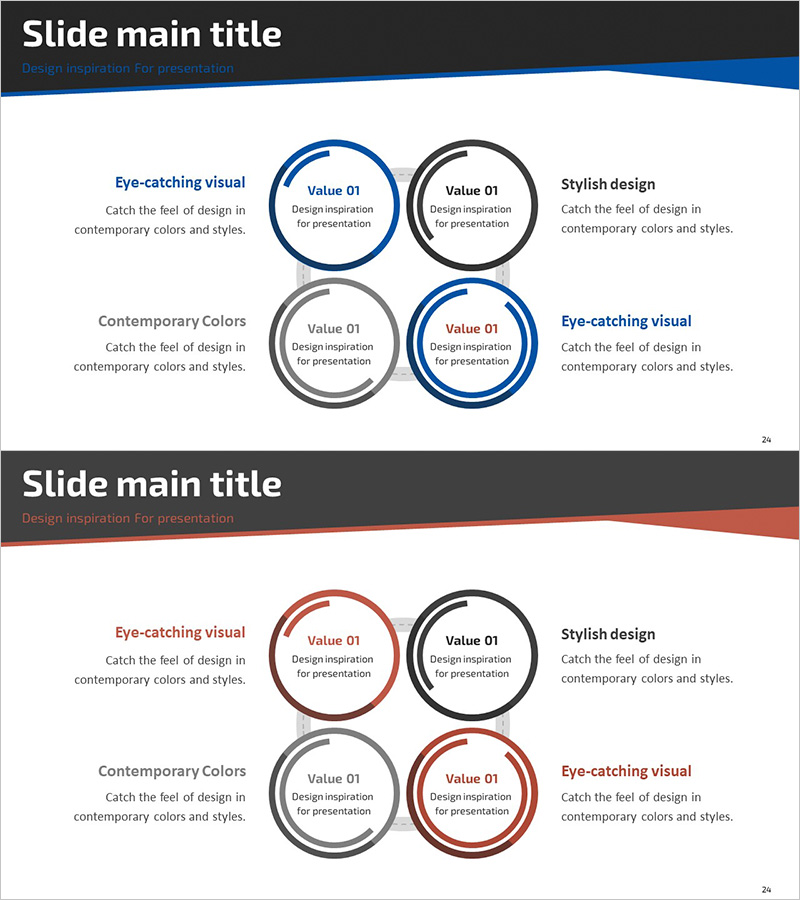
Circular Graph Diagram for Business Introduction
RJ0300076_28
- Last Update 12/21/2025
- File Size 1.2MB
- # of Slides 2
- File Format PPTX
- Slide Ratio 16:9
- Color
Keywords
About the Product
This slide uses a circular graph diagram to vividly illustrate key points and areas of the business. The simple yet intuitive design helps to convey information at a glance, while the contrasting blue and red colors enhance visual appeal. Suitable use cases include business status presentations, market research reports, or business strategy explanations. This slide easily fits into any major presentation in a business environment, and text and graph elements can be easily replaced, with editing difficulty rated as 'easy'.
Related Products
-

National Breakdown of Natural Energy Resources
#Market and Competitor Analysis #Corporate Social Responsibility #Graph
-
Concise Business Objectives Slide – Vision and Strategy
#Business Introduction #Business Vision and Strategy #Text Box
-
Automotive Sales Target Global Market – Market Analysis and Opportunities
#Company Introduction #Market and Competitor Analysis #Other
-

Origami Presentation Template for Company Introduction
#Company Introduction #Company Overview
