
Product/Service
Market Share Donut Pie Chart – Insightful Data Visualization
RJ0300073_5
- Last Update 12/21/2025
- File Size 2.6MB
- # of Slides 2
- File Format PPTX
- Slide Ratio 16:9
- Color
Keywords
About the Product
This slide utilizes a donut pie chart to intuitively visualize market share. The harmonious color arrangement of orange, black, and blue captures the audience's attention and facilitates easy understanding of data proportions. Infused with the theme of 'insight', it is suitable for business strategy and product introduction presentations. Users can easily replace text and data, and the editing difficulty is rated as 'easy', allowing for quick application in various presentation materials.
Related Products
-
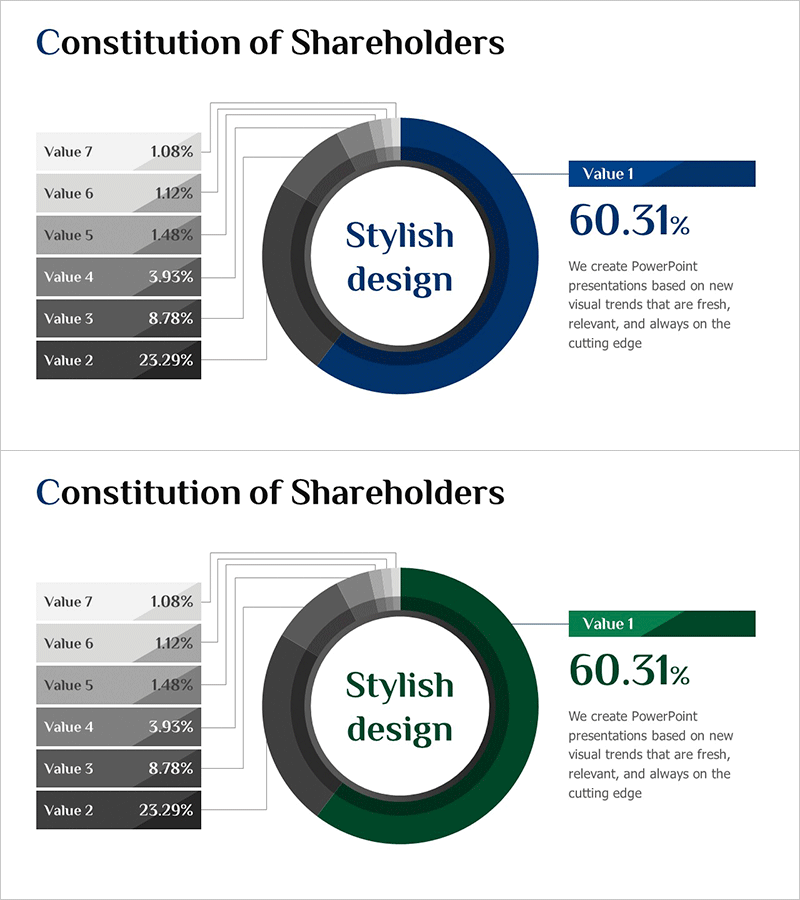
Chart of Changes in the Ratio of Institutional and Individual Investors – Simplified Shareholder Composition
#Company Introduction #Market and Competitor Analysis #Graph
-
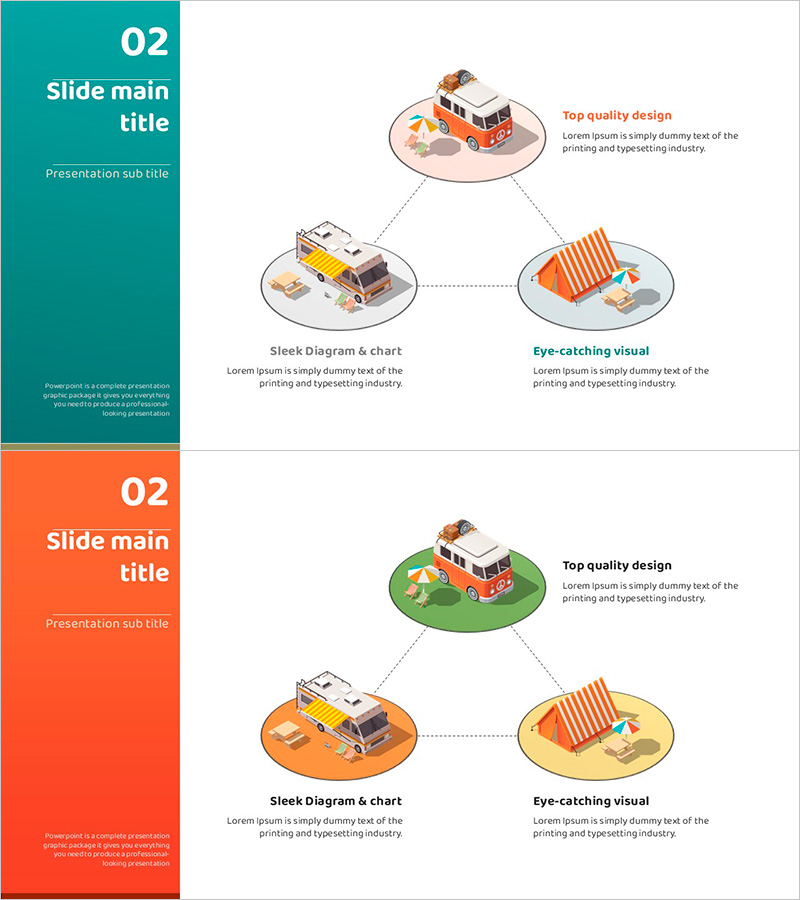
Camping Isometric Work Process Diagram – Deriving Business Strategy
#Business Vision and Strategy #Technology Sector #Diagram
-
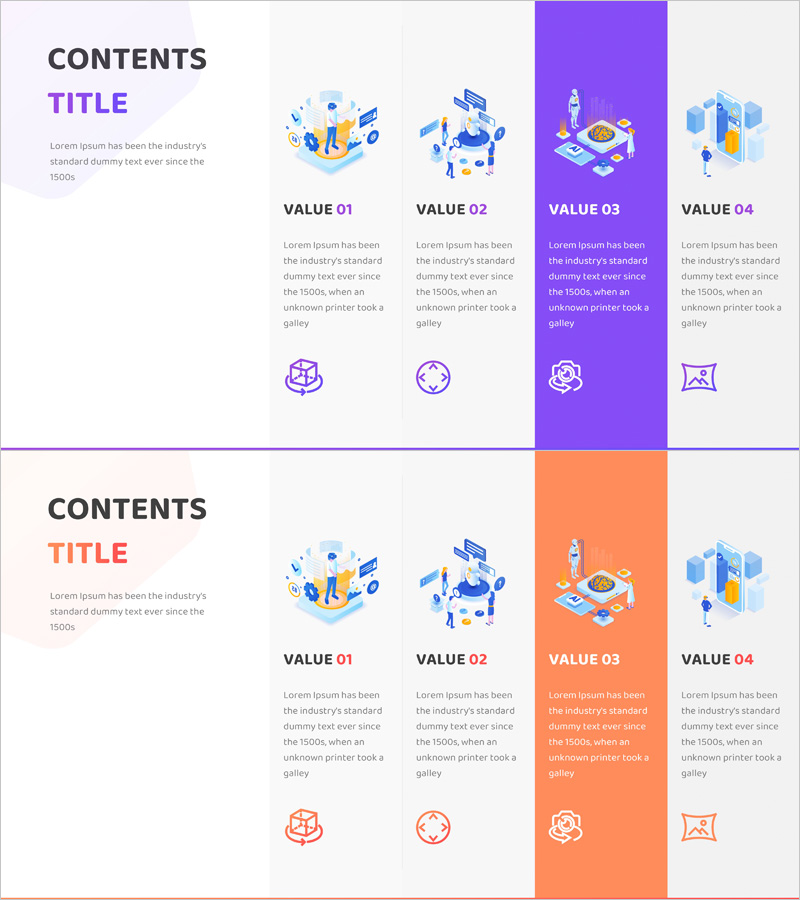
VR System Program Introduction – Marketing Strategy and Cluster
#Product/Service #Marketing Plan and Strategy #Diagram
-
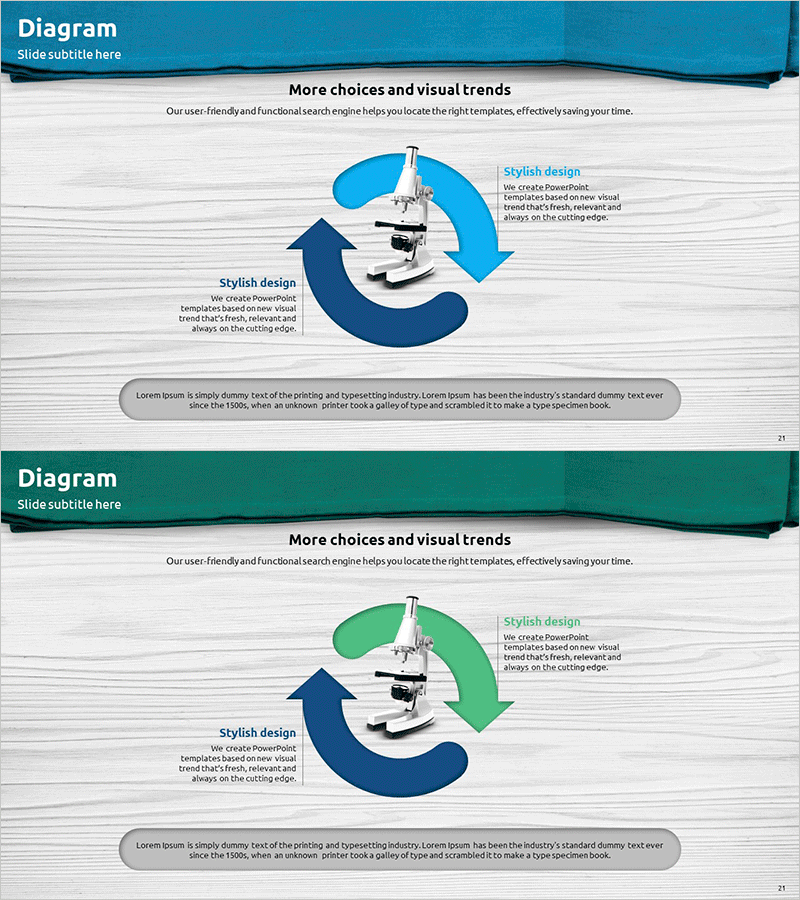
Microscopic Analysis Circulation Diagram – Differentiated Product Strategy
#Product/Service #Diagram #Product/Service Introduction
