Business Introduction
Business Idea Development Analysis Circle Graph
RJ0300070_17
- Last Update 12/21/2025
- File Size 0.1MB
- # of Slides 2
- File Format PPTX
- Slide Ratio 16:9
- Color
Keywords
About the Product
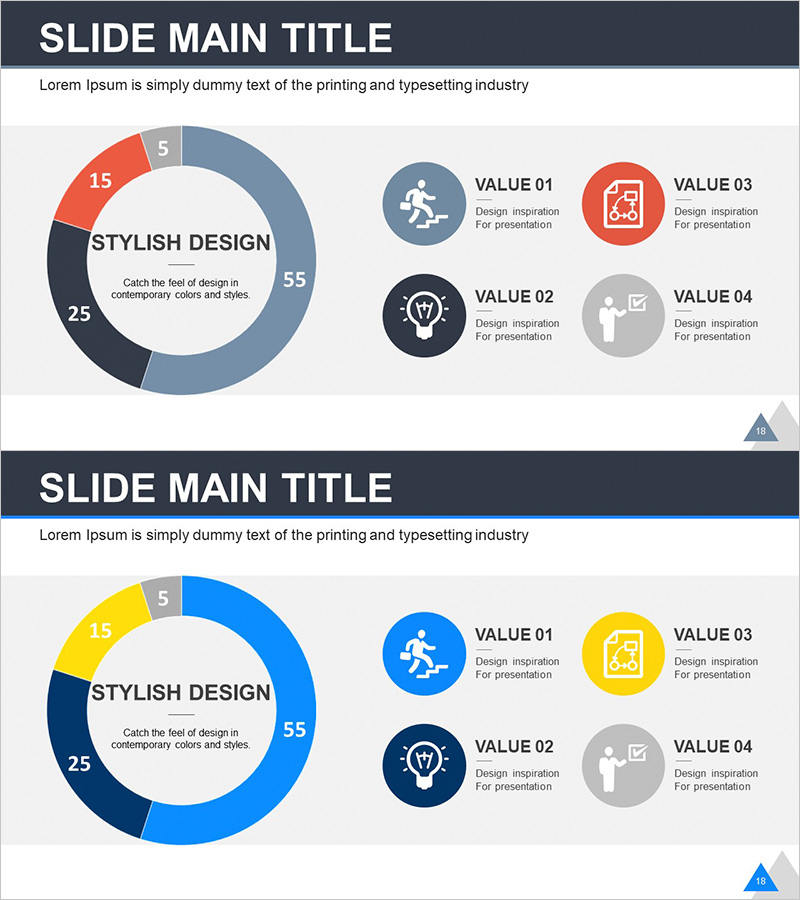
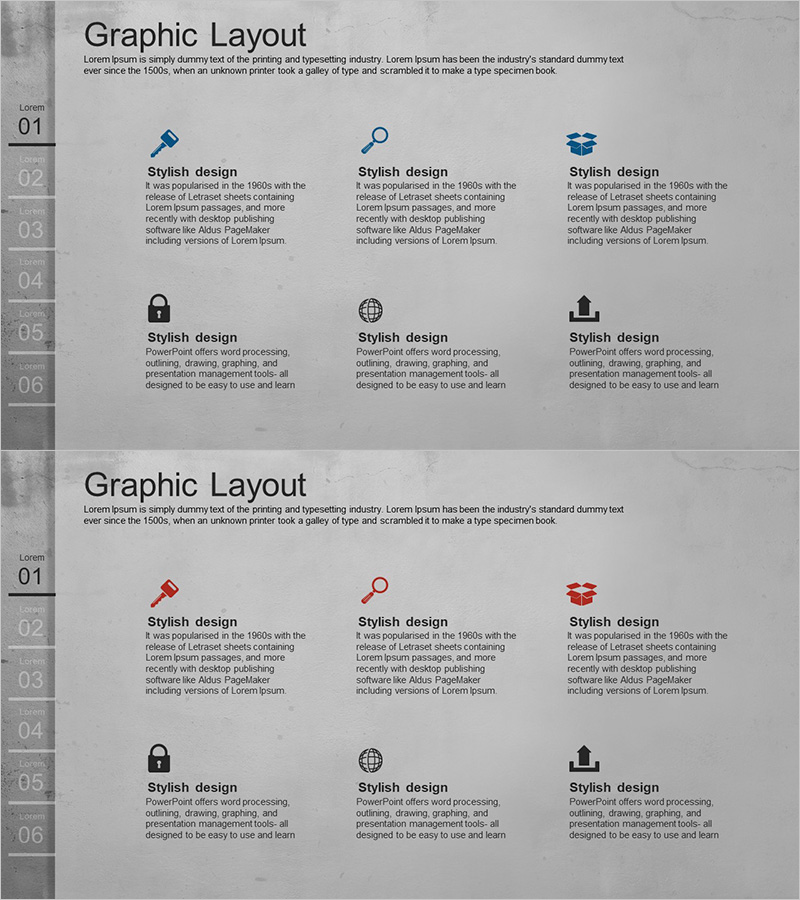
This slide features a circle graph designed for business idea development and analysis. Its clean and modern design format helps easily understand the proportions of each element. The use of red and yellow colors gives it a dynamic feel, leaving a strong visual impression. This circle graph is suitable for explaining market conditions, competitive analysis, and technological status. It is easy to interchange text and data, with an editing difficulty rated as average.
Related Products
-
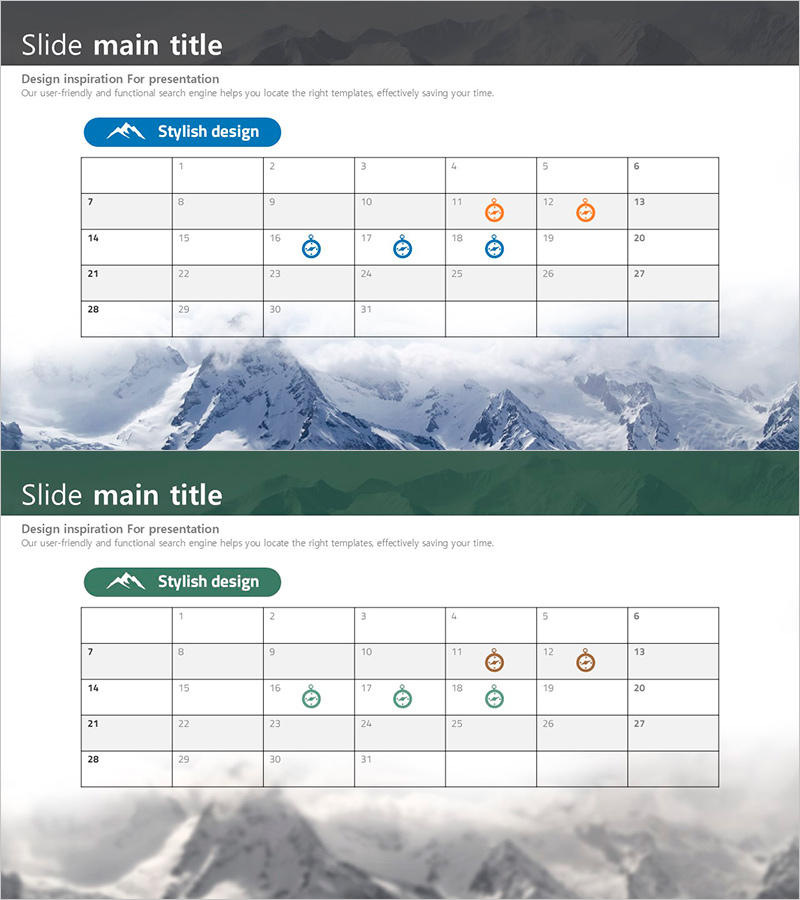
Climbing Schedule Visualized in Calendar Format – A Tool for Efficient Operations
#Business Management #Operation Plan #Diagram
-
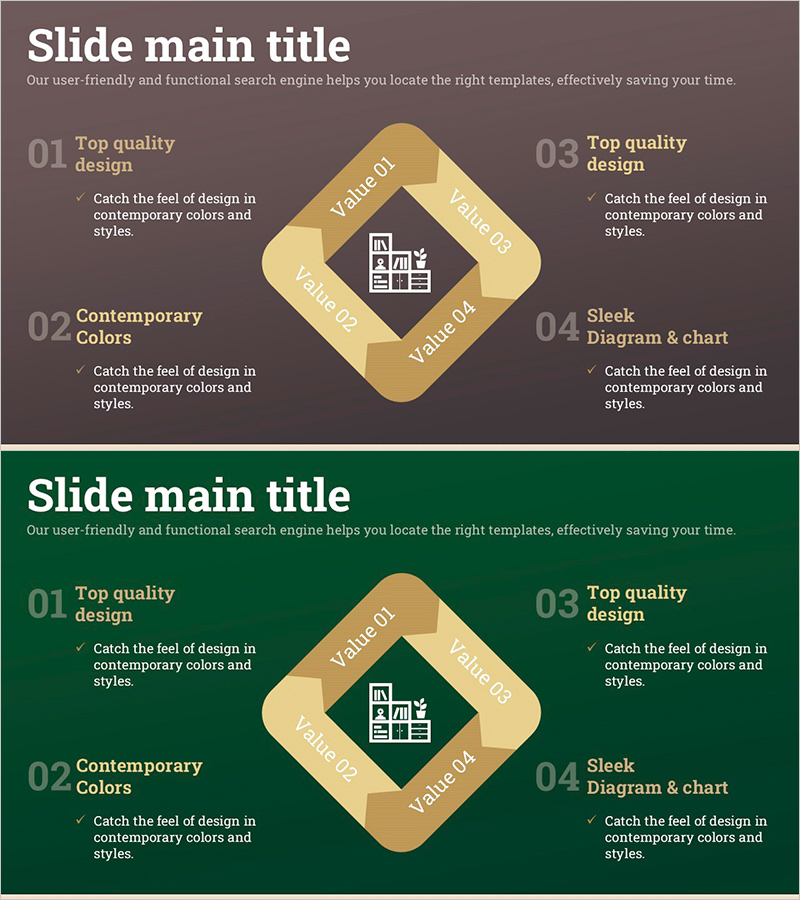
Cabinet Connection Diagram – A Functional Design
#Diagram
-
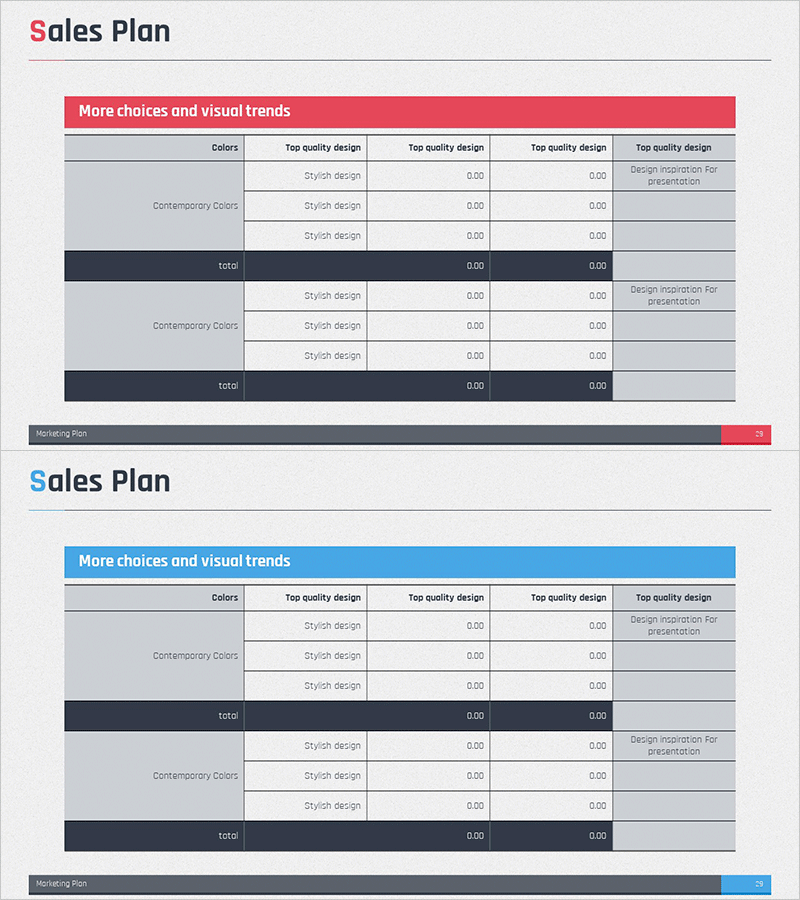
Sales Revenue Analysis Table – Operational Planning and Performance
#Operation Plan #Financial Plans and Performance #Diagram
-
Cement Theme Company Overview – Trust and Stability
#Company Introduction #Business Introduction #Company Overview
