Business Introduction
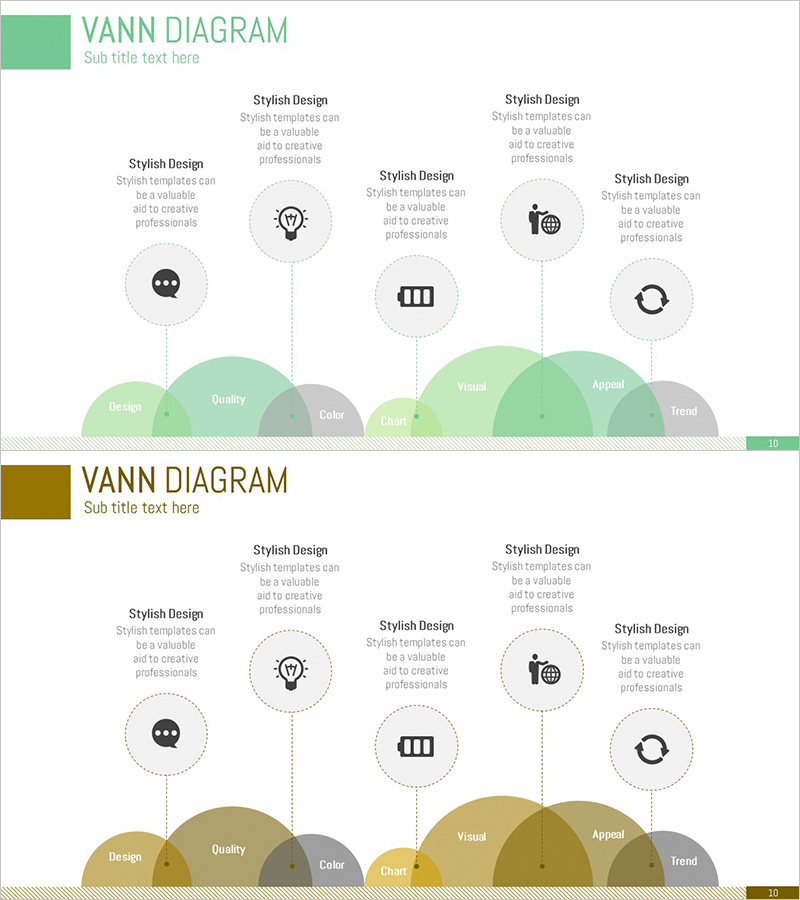
Business Area Overlap Diagram – Integration of Strategy and Vision
RJ0300065_9
- Last Update 12/21/2025
- File Size 0.2MB
- # of Slides 2
- File Format PPTX
- Slide Ratio 16:9
- Color
Keywords
About the Product
This slide utilizes a Business Area Overlap Diagram to visually represent the connections and overlaps among various business sectors. The design, composed of a blend of green, yellow, and brown, conveys a sense of trust and differentiation, making it easy to communicate complex information. This diagram is particularly suited for presentations on corporate vision and strategy, as well as business introductions. It is especially useful for practitioners looking to convey corporate direction and growth strategies. The text and icon areas are easy to replace, with an overall editing difficulty rated as 'easy', allowing for quick application in diverse presentations.
Related Products
-
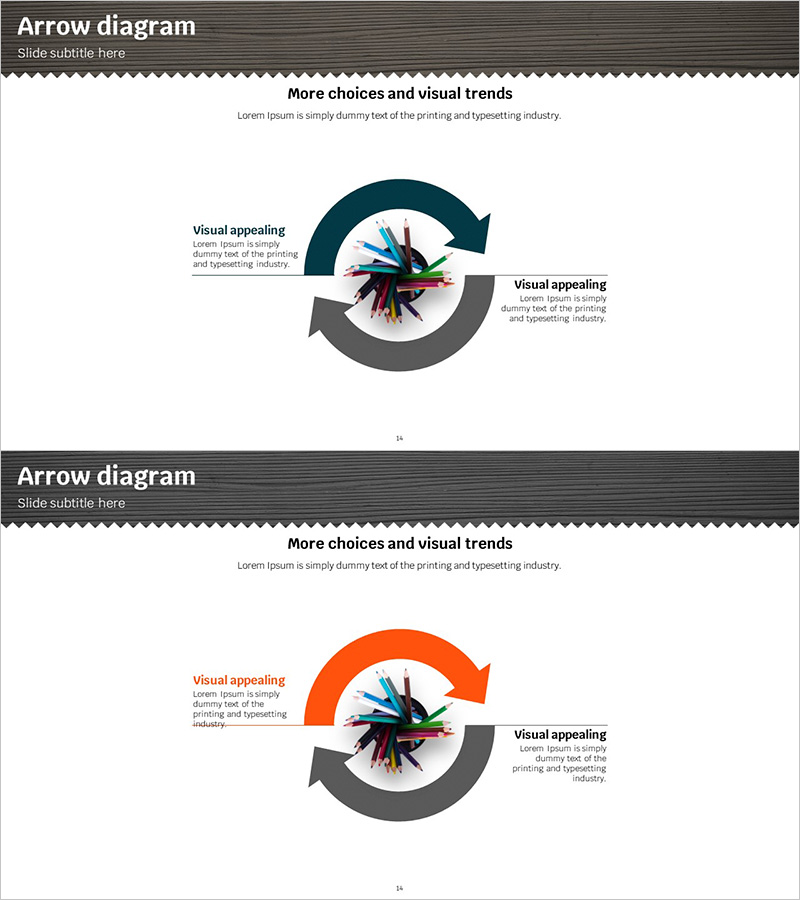
Visualizing Marketing Strategies with Circular Arrow Diagram
#Product/Service #Marketing Plan and Strategy #Diagram
-
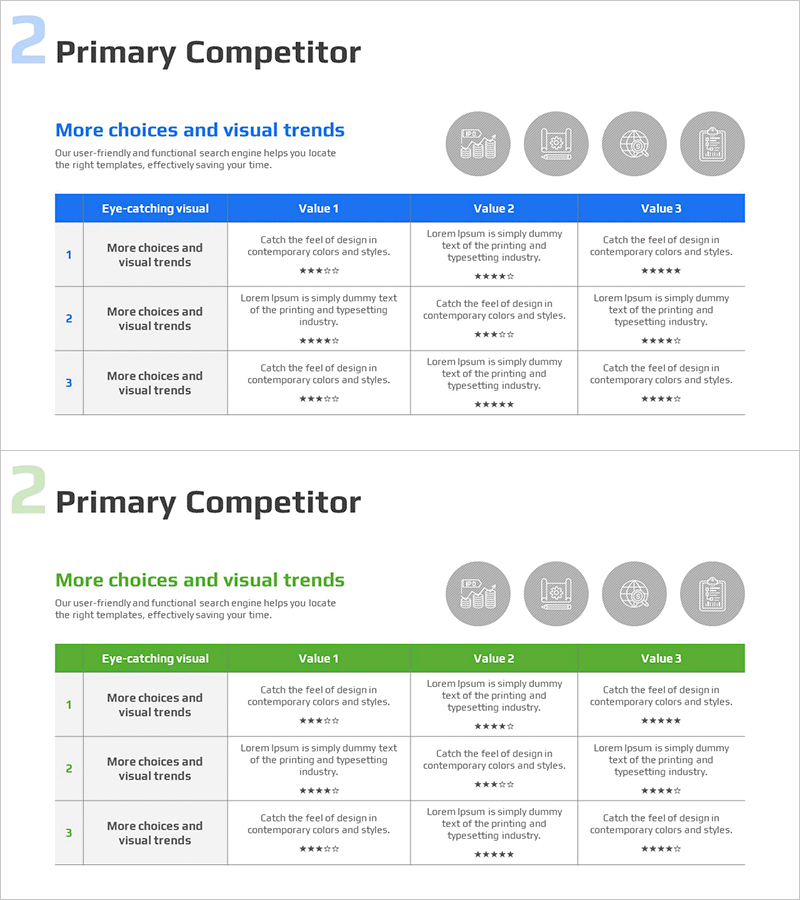
Competitor Marketing Strategy and Performance Analysis Chart
#Market and Competitor Analysis #Diagram #Competitor Analysis
-
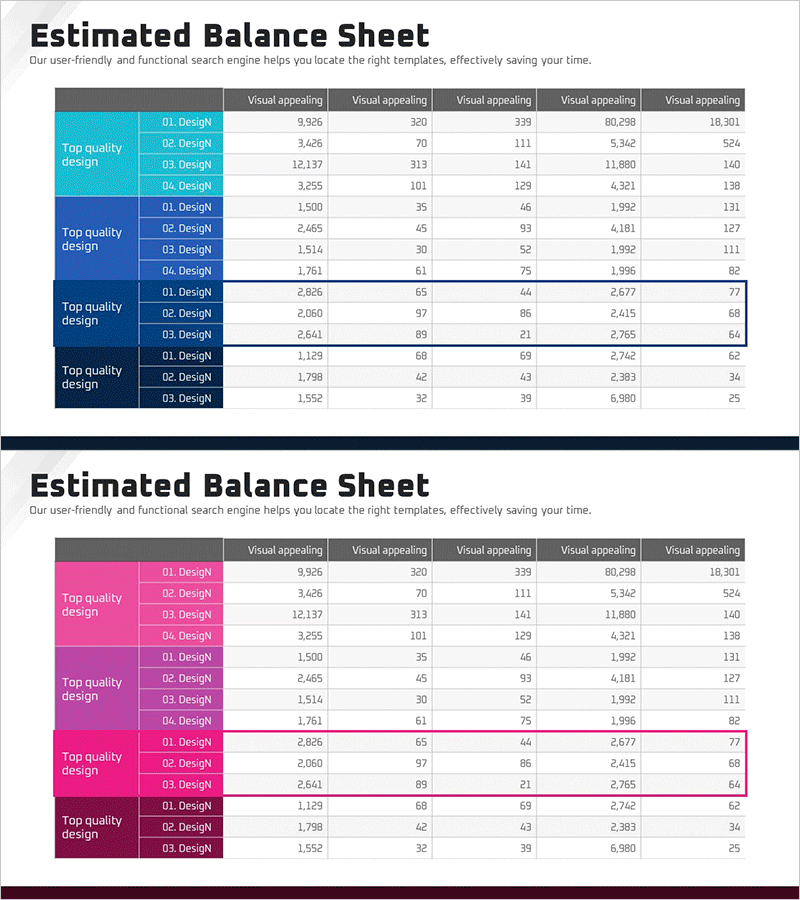
Balance Sheet by Business Area Presentation Slide
#Market and Competitor Analysis #Financial Plans and Performance #Diagram
-

Step-by-step Schedule to Achieve Your Goals Slide – Business Strategy Implementation
#Business Promotion Strategy #Marketing Plan and Strategy #Diagram
