Product/Service
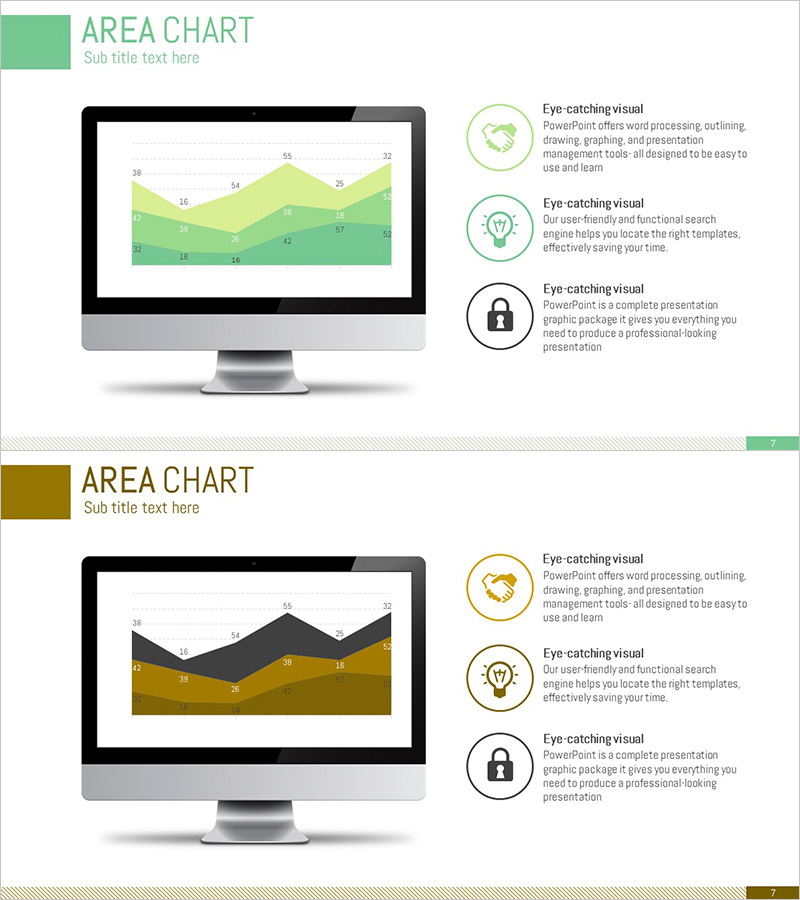
Business Analysis Area Type Graph – The Core of Data Visualization
RJ0300065_6
- Last Update 12/21/2025
- File Size 1MB
- # of Slides 2
- File Format PPTX
- Slide Ratio 16:9
- Color
Keywords
About the Product
This slide provides an area chart that effectively visualizes key business data. Its clean design allows for intuitive communication of information, utilizing a harmonious color palette of green, yellow, and brown that conveys trust and stability. This slide is constructed to center around product or service introductions, allowing users to effectively use it for business analyses or strategic reports. Combined with appropriate design elements, it enables diverse audiences to easily comprehend data flows and changes.
Related Products
-
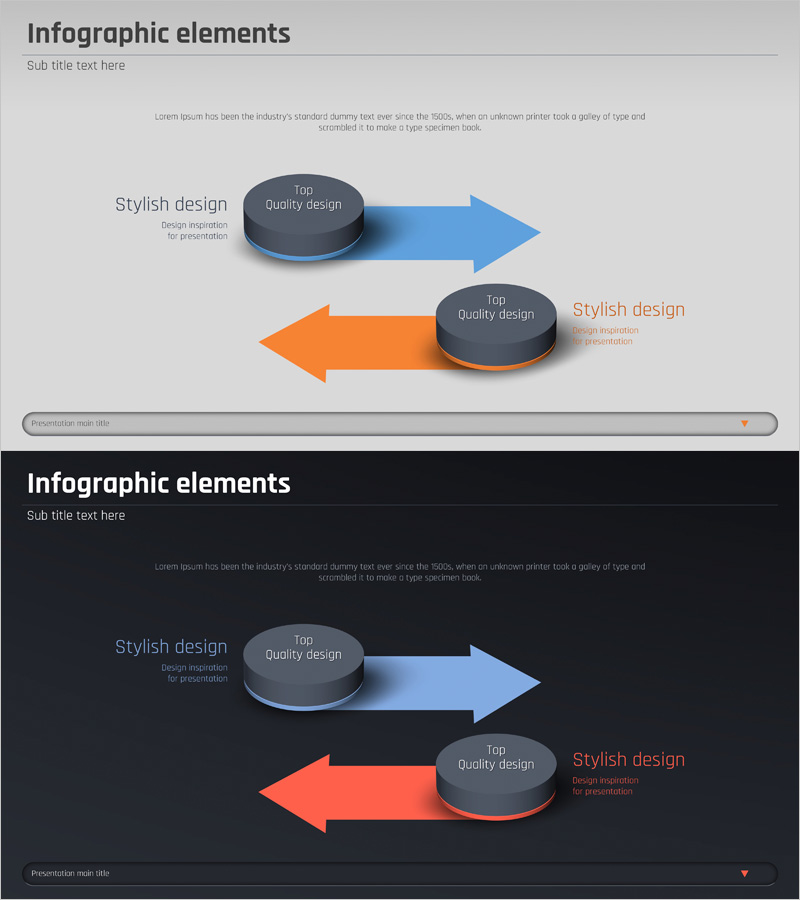
Marketing Strategy Arrow Diagram – Illustrating Business Flow
#Business Vision and Strategy #Marketing Plan and Strategy #Diagram
-
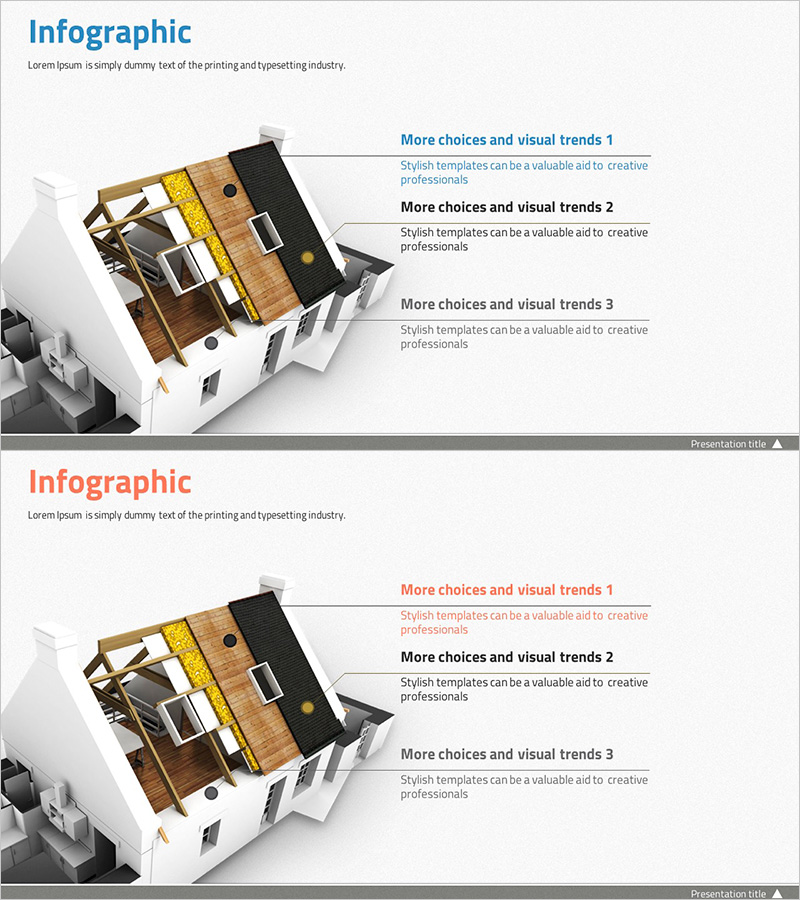
Building Structure Composition Contents Slide – Product and Service Introduction
#Product/Service #Diagram #Product/Service Introduction
-
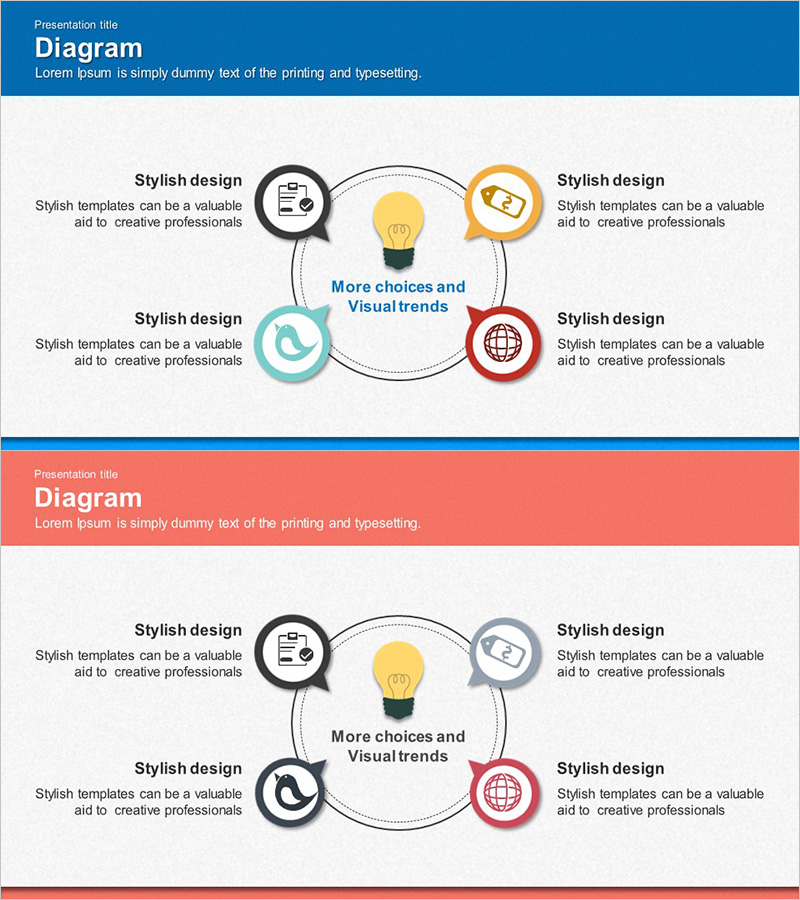
Illustration Theme Solution Diagram – Creative Approach
#Company Introduction #Operation Plan #Diagram
-
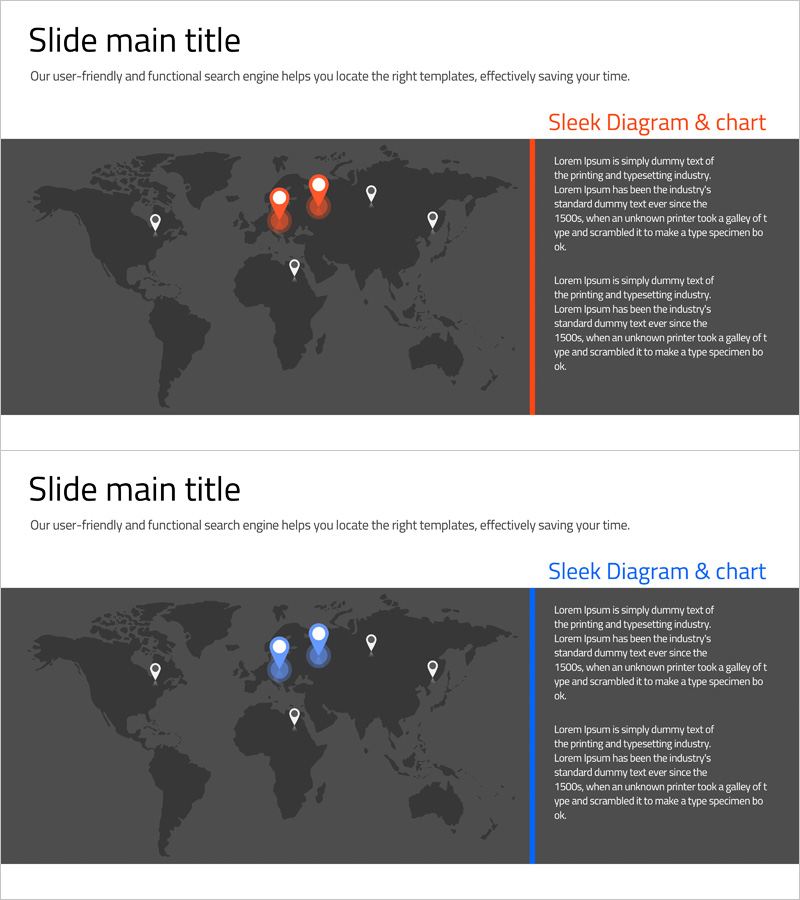
Global Network Target Market Strategy – Insights for Global Business Expansion
#Company Introduction #Market and Competitor Analysis #Other
