Financial Plans and Performance
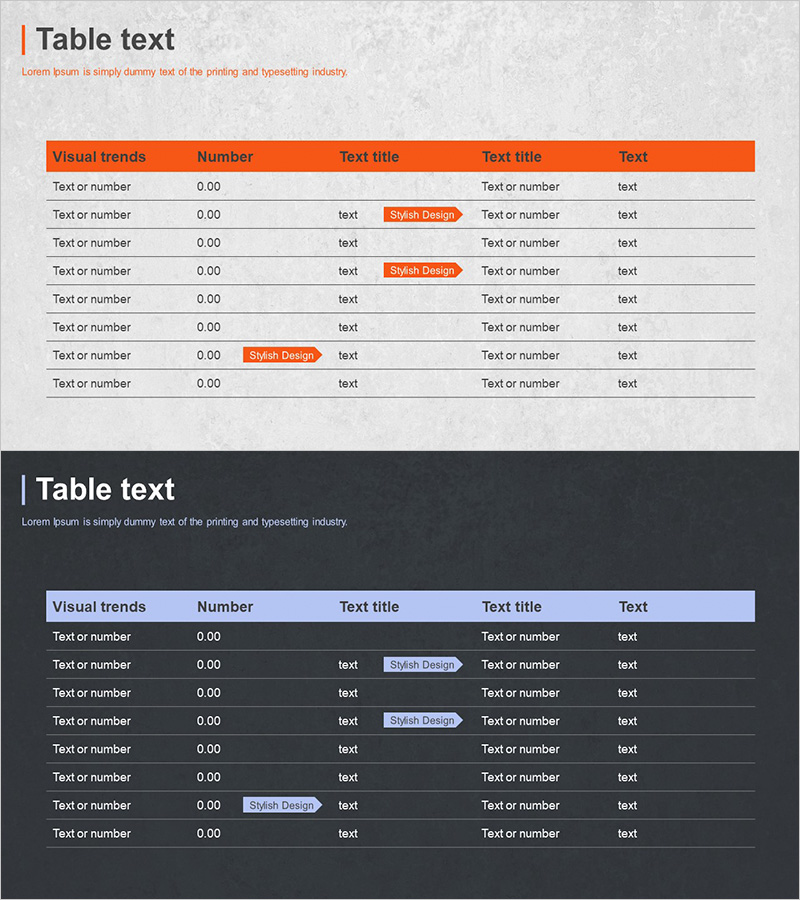
Key Financial Indicators Table – Effective Data Presentation
RJ0300056_10
- Last Update 12/21/2025
- File Size 4MB
- # of Slides 2
- File Format PPTX
- Slide Ratio 16:9
- Color
Keywords
About the Product
This slide presents key financial indicators in a clean table format. The harmonious orange and purple color scheme enhances readability and offers a user-friendly editing structure. Ideal for financial planning and performance reports, the highlight of 'Stylish Design' elevates attention and maximizes professionalism in business presentations. Each text and number can be easily replaced, with an overall editing difficulty rated as 'easy', making it accessible for anyone to use.
Related Products
-

Botanical Garden Wide PPT Organization Chart – Visualizing Staff Structure
#Company Introduction #Diagram #Organizational Chart
-

Business End Goal Square Diagram
#Business Vision and Strategy #Marketing Plan and Strategy #Diagram
-
Global Target Regional Goals – Visualizing Marketing Strategies and Clusters
#Company Introduction #Marketing Plan and Strategy #Diagram
-

Sugar Content by Fruit – Revenue Performance Analysis
#Product/Service #Financial Plans and Performance #Diagram
