Market and Competitor Analysis
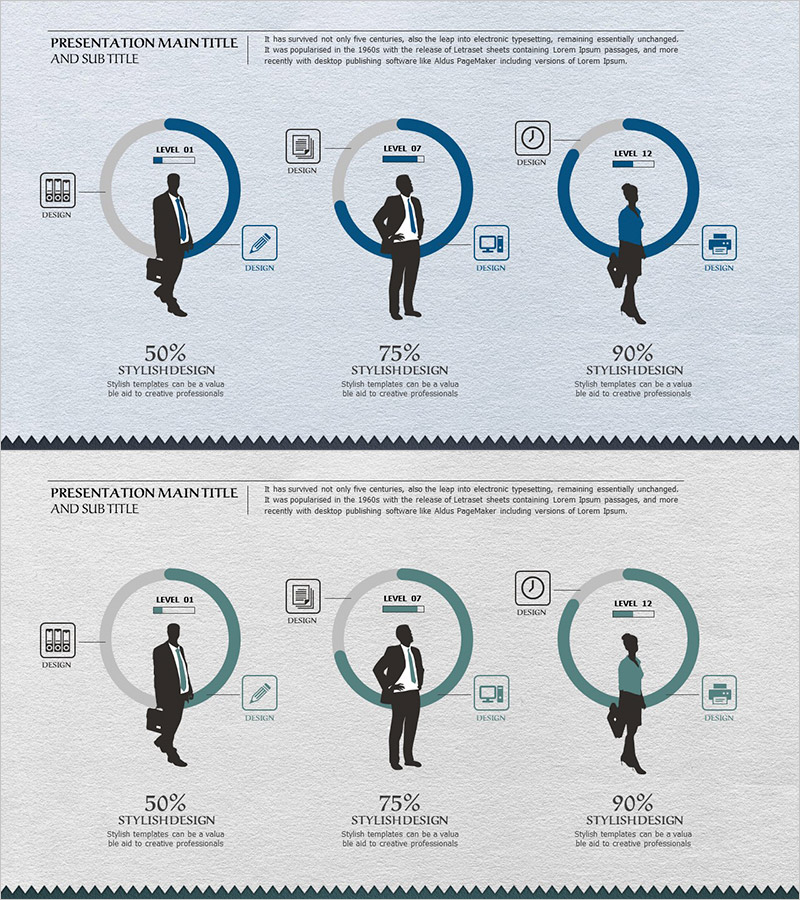
Work Performance Analysis Graph – Visually Representing Employee Performance
RJ0300048_7
- Last Update 12/21/2025
- File Size 6.2MB
- # of Slides 2
- File Format PPTX
- Slide Ratio 16:9
- Color
Keywords
About the Product
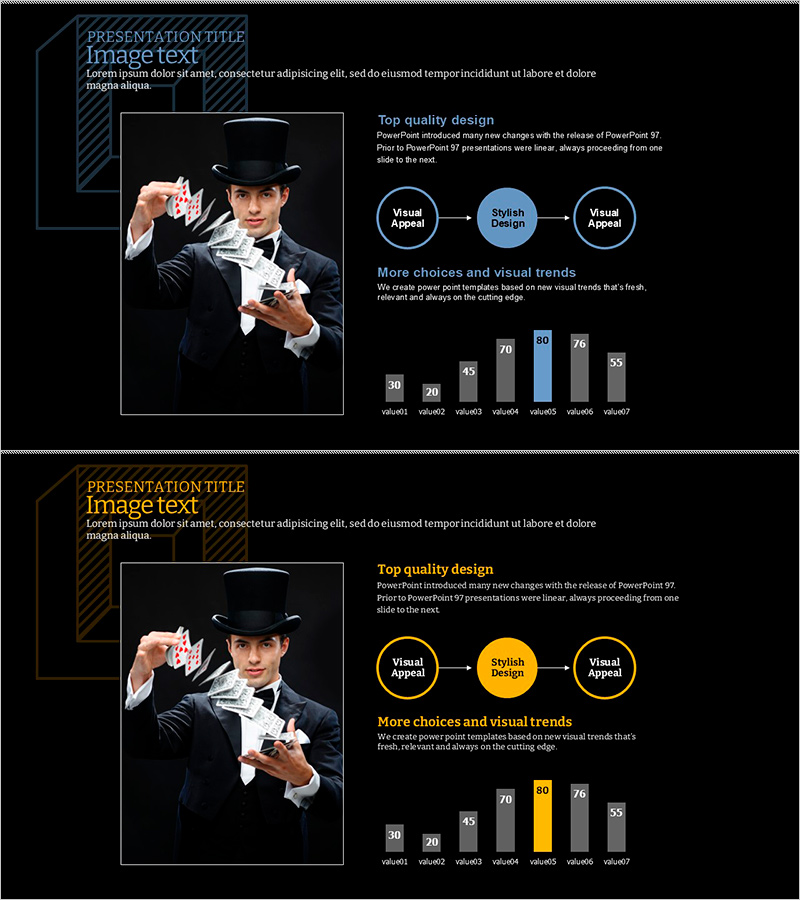
This slide presents an analysis of employee work performance using a donut chart for clear visual representation. The structured design helps easily understand performance at each level, making it ideal for employee evaluations or performance review meetings. It features a harmonious color palette of blue and green, ensuring clarity and easy comprehension of information. The text and graph are easily replaceable, with an editing difficulty rated as 'easy', allowing quick integration into various presentations.
Related Products
-
Office Supplies Theme Competitive Analysis Bar Graph
#Market and Competitor Analysis #Graph #Competitor Analysis
-
Horizontal Bar Graph Slide Template for European Tourism Demand Survey
#Market and Competitor Analysis #Graph #Market Status
-
Auto Industry Roadmap – Visualizing Business Strategy
#Business Vision and Strategy #Business Promotion Strategy #Diagram
-
Magic Analysis Chart for Visualizing Operations and Marketing Goals
#Operation Plan #Marketing Plan and Strategy #Diagram
