Business Promotion Strategy
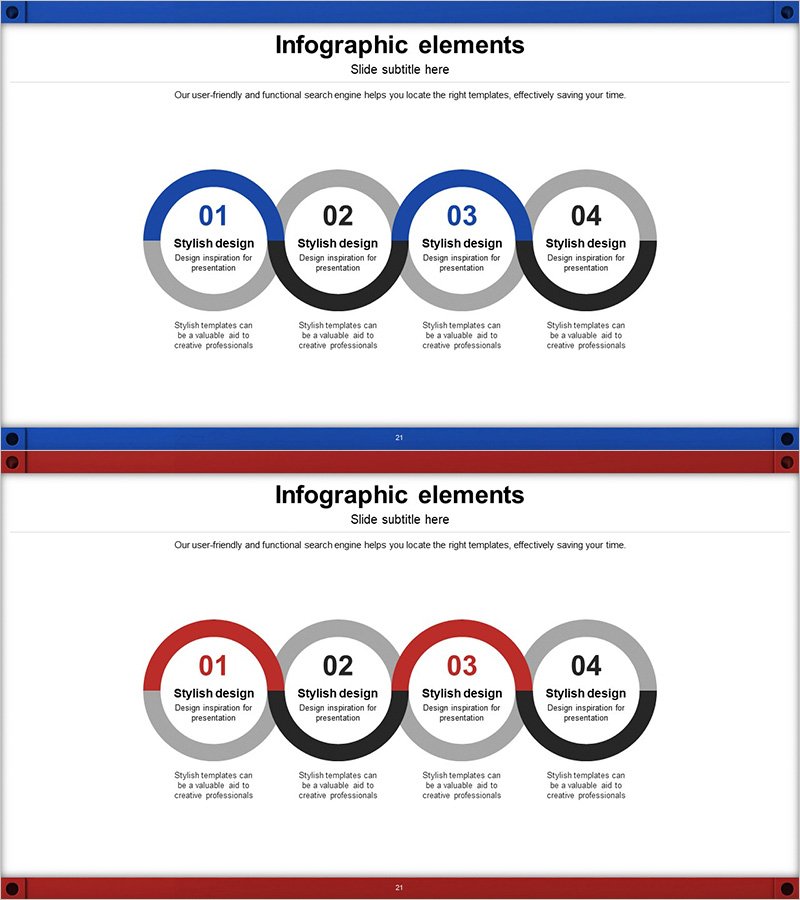
Visualizing Business Strategy with Connected Circular Infographic
RJ0300043_20
- Last Update 12/21/2025
- File Size 2.9MB
- # of Slides 2
- File Format PPTX
- Slide Ratio 16:9
- Color
Keywords
About the Product
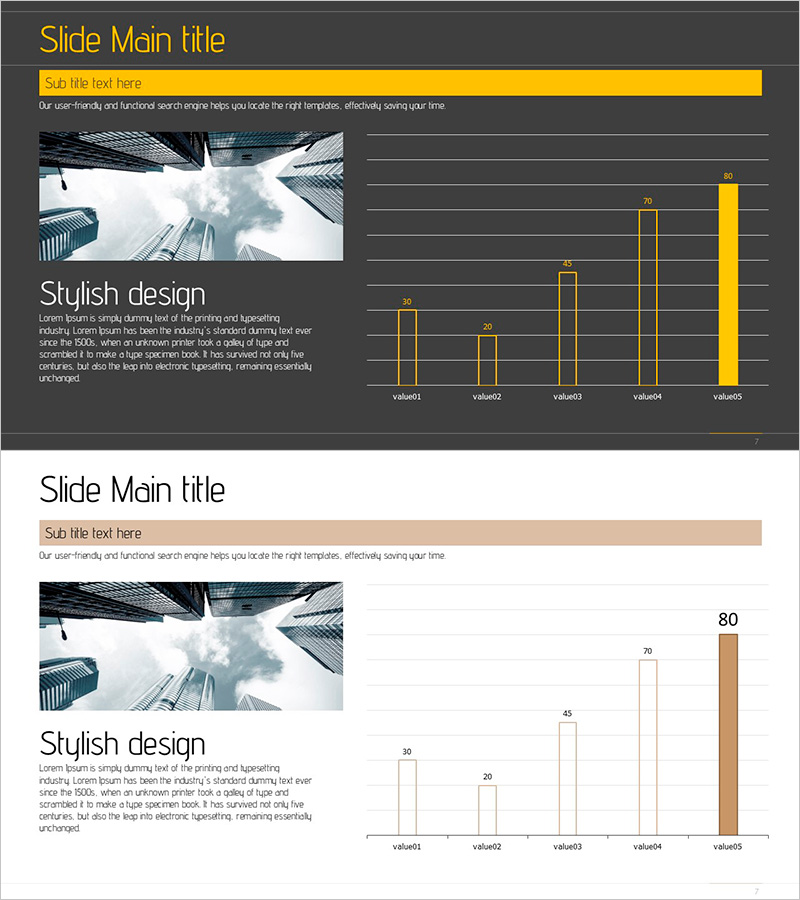
This slide utilizes a circular infographic to intuitively visualize business strategies. With minimal decoration and a balanced composition, it clearly represents the relationship between steps and components. It is effectively applicable for business presentations, step-by-step schedule planning, and project management. The primary colors of blue and red convey trust and energy, while the easy text and graph replacement ensures a low editing difficulty for quick integration into various presentations.
Related Products
-
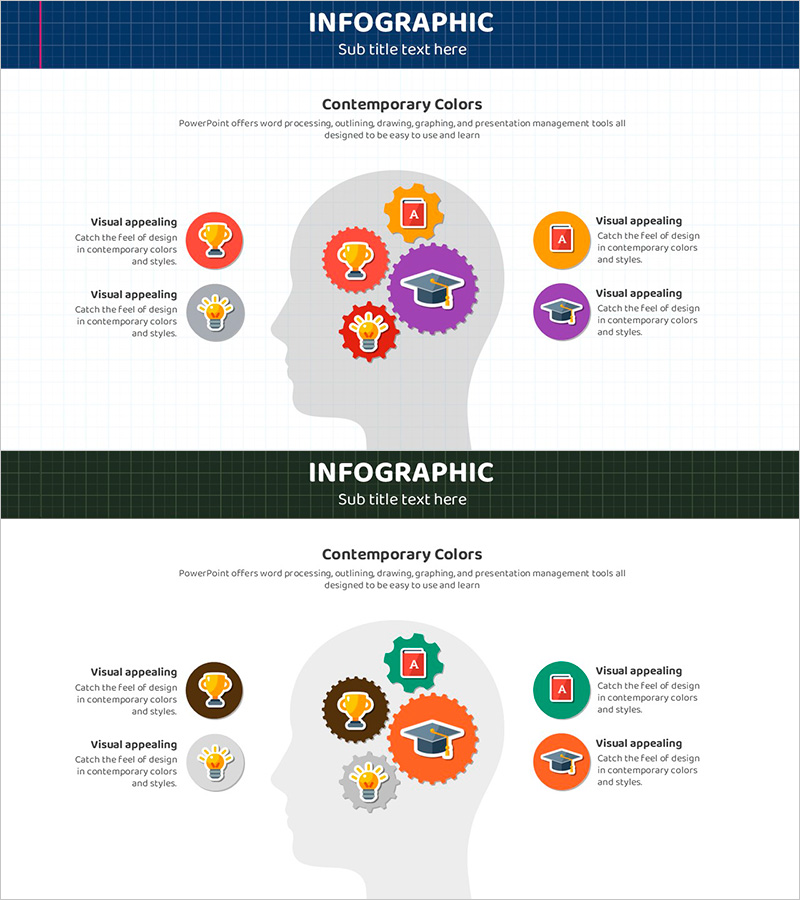
Human Silhouette and School Stickers PowerPoint Template – Education and Creativity
#Product/Service #Diagram #Other
-
Introduction to Business Key Programs – Impactful Cluster Diagram
#Product/Service #Diagram #Product/Service Introduction
-
Plotting Paper Presentation Template Diagram5 – Business Management and Quality Assurance Plan
#Business Management #Execution Plan #Quality Assurance Plan
-
Visualizing Successful Business Performance with Horizontal Bar Chart
#Company Introduction #Business Promotion Strategy #Graph
