Business Area Diagram – Infographic Slide to Enhance Understanding of Core Business
RJ0300021_13
- Last Update 04/23/2025
- File Size 5.6MB
- # of Slides 2
- File Format PPTX
- Slide Ratio 16:9
- Color
Keywords
- #Content-Based Slides
- #Design-Based Slides
- #Company Introduction
- #Business Introduction
- #Diagram
- #Business Areas
- #Business Areas
- #Spread
- #Centralized Diagram
- #16:9
- #radial diagram PowerPoint
- #business area diagram slide
- #central hub infographic
- #business structure visualization
- #how to create radial diagram in PowerPoint
About the Product
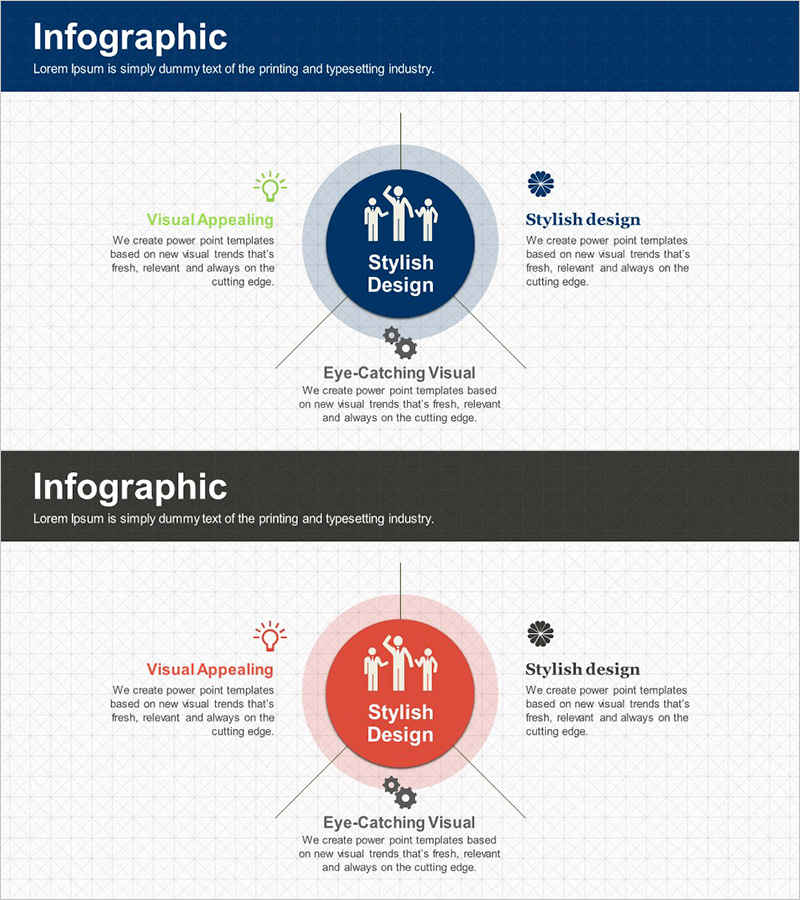
A radial diagram PowerPoint slide that expands from a central core concept to three key business areas. Features a dark blue central hub with light blue outer layers representing hierarchy, plus icons and text fields for each zone. Ideal for visualizing business structure, core value expansion, business model analysis, and strategic positioning in presentations. Includes 2 slides with dark blue and red color variations, optimized for 16:9 widescreen format. Fully editable for immediate use in business decks, company introductions, and strategic presentations.
Usage Points
-
Main Usage
Positions core business concept at center and expands to three key areas, enabling clear explanation of business portfolio, business models, organizational roles, and strategic pillars. The distinct hierarchy between central hub and outer layers intuitively communicates relationships between primary concept and supporting elements.
-
How to Use
Enter core concept in central circle (e.g., Stylish Design), then add main topics and descriptions in three outer zones (e.g., Visual Appealing, Stylish design, Eye-Catching Visual). Customize by replacing icons, adjusting colors, or modifying text to match your presentation theme. Works for business explanations, strategy presentations, organizational overviews, and investor pitches.
-
Recommended For
Executives, planners, and marketing professionals presenting business plans, company profiles, and product introductions. Effective for investment pitch decks visualizing business portfolio, strategy meetings explaining organizational structure around core pillars, and corporate presentations breaking down service areas.
-
Slide Structure
2-slide set: Slide 1 features dark blue central node (1 hub) + light blue outer layer (3 zones) + 3 icons + 3 text areas; Slide 2 identical structure in red. Vertical axis line from center connects to three zones, establishing clear hierarchical relationships in radial layout.
Related Products
-

Financial Management Services Area Diagram – Visualizing Business Areas
#Company Introduction #Business Introduction #Diagram
-

Business Value Diagram – Visualizing Business Sectors
#Company Introduction #Business Introduction #Diagram
-

Mobile Security Service Diagram
#Company Introduction #Business Introduction #Diagram
-

Vaccine Diffusion Diagram – Business Introduction and Diffusion Strategy
#Company Introduction #Business Introduction #Diagram
