US Target Area Analysis Map
RJ0300011_8
- Last Update 04/21/2025
- File Size 0.4MB
- # of Slides 2
- File Format PPTX
- Slide Ratio 16:9
- Color
Keywords
About the Product
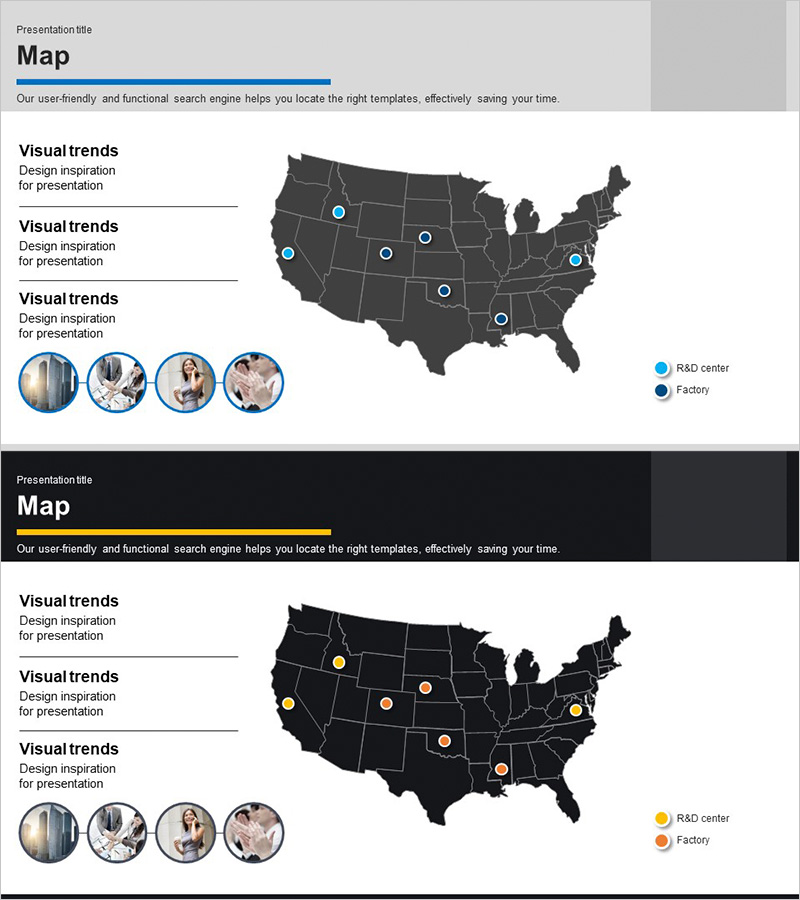
A professional US map PowerPoint slide featuring a dark background with strategic location markers across the nation. This two-slide set uses blue and orange markers to clearly distinguish between R&D centers and factory locations. The left side includes three text input sections for detailed descriptions and four circular image placeholders for company information, facility profiles, and team members. The layout effectively communicates global network presence, target market analysis, and competitive positioning. Ideal for business presentations, investor pitches, and market expansion strategies. Fully editable PPTX format ready for immediate customization.
Usage Points
-
Main Usage
Visualize your company's US business locations, manufacturing facilities, and research centers on a professional map to communicate global network scale and strategic positioning to executives, investors, and business partners.
-
How to Use
Use this slide in company overview presentations, business briefings, and investor pitch decks within the global network section. Customize marker colors and locations to reflect your actual facilities. Add or remove markers as needed to match your current operational footprint.
-
Recommended For
Global manufacturing, IT, and biotech companies presenting to executives, investors, and partners. Particularly valuable for market entry strategies, competitive landscape analysis, business expansion planning, and demonstrating US market presence and operational scale.
-
Slide Structure
Two-slide set with dark background US map centered on each slide, three text input sections on the left (Visual trends repeated), four circular image placeholders for profiles, and a legend on the right distinguishing R&D centers from factories. First slide features blue markers; second slide uses orange markers for visual variety.
Related Products
-

Dawn City Theme Global Map
#Company Introduction #Market and Competitor Analysis #Other
-

Target Market Goal Map for Global Market Analysis
#Company Introduction #Market and Competitor Analysis #Other
-

Global Network Target Region Analysis – Stylish Design Visualization
#Company Introduction #Market and Competitor Analysis #Other
-

Target Market Global Network Map – Visualizing Business Strategy
#Company Introduction #Market and Competitor Analysis #Other
