Modern Infographic Slide for Data Visualization
RJ0300010_21
- Last Update 04/20/2025
- File Size 4.7MB
- # of Slides 2
- File Format PPTX
- Slide Ratio 16:9
- Color
Keywords
About the Product
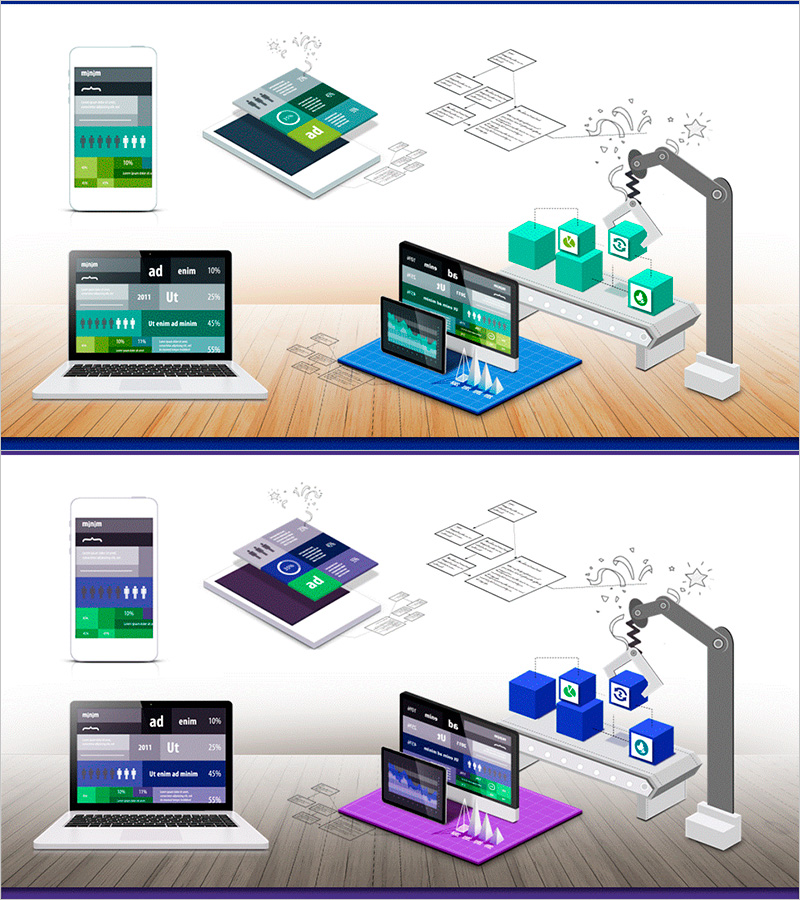
A device mockup icon slide set designed for visualizing data and technology solutions. Features three device elements—smartphone, laptop, and robotic arm—enabling intuitive presentation of mobile apps, web platforms, and automation technology. The turquoise, purple, and blue color palette creates an IT-focused atmosphere, with data visualization elements (charts, graphs, icons) positioned on each device to maximize information delivery. Composed of 2 slides in 16:9 widescreen format, fully editable in PPTX. Perfect for tech companies, software platforms, and digital transformation initiatives seeking professional device-based visual communication.
Usage Points
-
Main Usage
Optimized for IT, technology, and software companies presenting product features and technical solutions. Enables side-by-side comparison of mobile apps, web platforms, and automation robots while combining data visualization elements to convey complex technical concepts intuitively to stakeholders.
-
How to Use
Insert product screenshots, charts, and icons onto each device mockup to explain technology stacks, platform architecture, and automation workflows. Ideal for investor pitch decks, technical seminars, and product launch presentations where emphasizing multi-channel solution capabilities is critical.
-
Recommended For
Recommended for IT, software, fintech, and SaaS company executives, development teams, and marketing professionals explaining technical solutions. Particularly effective for digital transformation, automation technology, and cross-platform service introduction presentations to enhance audience comprehension.
-
Slide Structure
Two-slide composition featuring three device mockups (smartphone, laptop, robotic arm) per slide. First slide uses turquoise background, second uses purple, creating visual variation. Each device includes positioned data charts, icons, and text areas for layered information hierarchy and professional presentation flow.


