Business Vision Overlay Diagram – Harmony of Clusters and Analysis
RJ0300009_6
- Last Update 04/20/2025
- File Size 0.1MB
- # of Slides 2
- File Format PPTX
- Slide Ratio 16:9
- Color
Keywords
- #Content-Based Slides
- #Design-Based Slides
- #Product/Service Introduction
- #Business Vision and Strategy
- #Diagram
- #Features
- #Business Vision
- #Cluster
- #Combination Diagram
- #16:9
- #overlay diagram PowerPoint
- #business vision slide template
- #cluster diagram presentation
- #3-node Venn diagram
- #intersection diagram PowerPoint
- #how to create overlay diagram in PowerPoint
About the Product
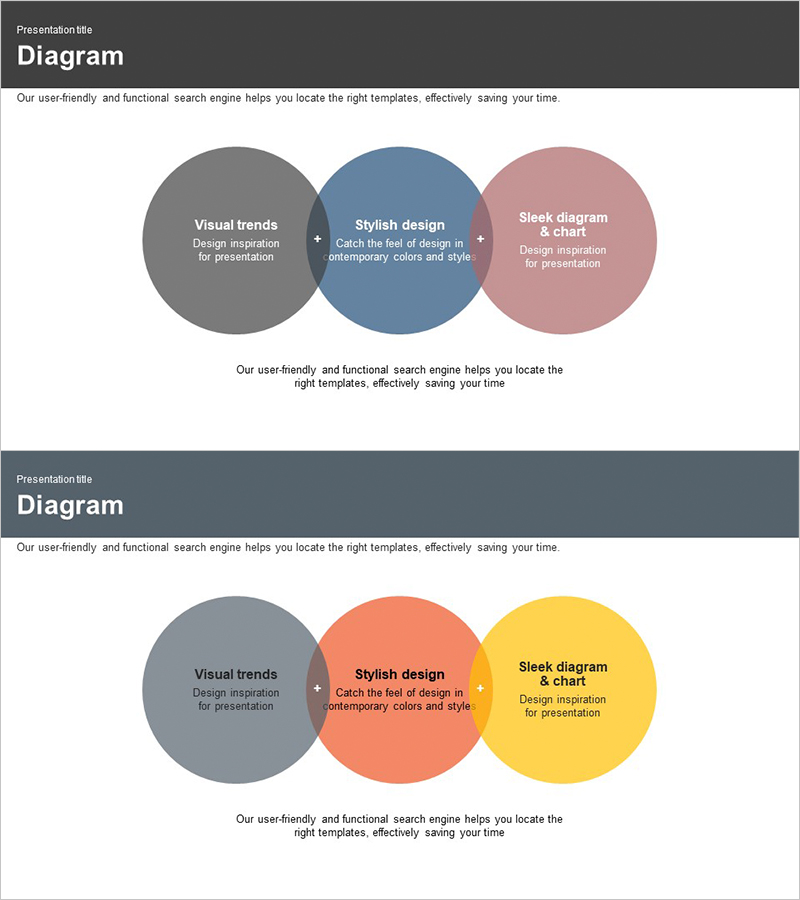
A 3-node overlay diagram PowerPoint slide designed to visualize business vision and strategic relationships. Three circular nodes in gray, blue, and pink overlap at the center, illustrating cluster harmony and mutual interaction through intersection areas. This 2-slide, 16:9 PPTX template is ready for business presentations, strategic planning decks, and organizational analysis slides. Clearly defined text input zones enable effective placement of core messages and detailed descriptions.
Usage Points
-
Main Usage
Represents business vision, strategy, and organizational interaction through overlapping structure, emphasizing synergies in intersection areas. Ideal for executive briefings, strategic planning, organizational analysis, and marketing positioning that require multi-layered concept explanation.
-
How to Use
Enter key concepts (Visual Trends, Stylish Design, Sleek Diagram) in each circular node, and place integrated messaging in the central intersection area. Use color differentiation to clarify categories and adjust text size to establish information hierarchy.
-
Recommended For
Recommended for executives, strategy teams, marketing teams, and organizational development teams explaining business models, competitive positioning, organizational capabilities, and market segmentation. Suitable for consulting reports, investor pitch decks, business plans, and strategic presentations.
-
Slide Structure
2-slide composition. Slide 1: Three circular nodes (gray, blue, pink) overlapping at center in Venn diagram structure with text input zones in each node and intersection area. Slide 2: Same structure with color variation (gray, orange, yellow) for diverse presentation contexts.
Related Products
-

Business Vision Overlay Diagram – Effectively Visualizing Vision and Strategy
#Product/Service Introduction #Business Vision and Strategy #Diagram
-

Synergized Vision Components Diagram
#Product/Service Introduction #Business Vision and Strategy #Diagram
-

Projected Impact of Implementing AI in Life Science Solution
#Business Vision and Strategy #Business Strategy #Diagram
-

Key Clients in Furniture Business – Flow of Design Inspiration
#Product/Service Introduction #Customer Success Stories #Diagram
