Arrow Diagram for Visualizing Target Market Strategy – Marketing Plan
RJ0300002_23
- Last Update 04/19/2025
- File Size 13.8MB
- # of Slides 2
- File Format PPTX
- Slide Ratio 16:9
- Color
Keywords
- #Content-Based Slides
- #Design-Based Slides
- #Marketing Plan and Strategy
- #Diagram
- #Target Market Strategy
- #Marketing Strategy
- #Flow
- #16:9
- #bidirectional arrow diagram PowerPoint
- #marketing strategy presentation slide
- #target market analysis diagram
- #dual-side comparison arrow slide
- #how to create marketing strategy diagram in PowerPoint
About the Product
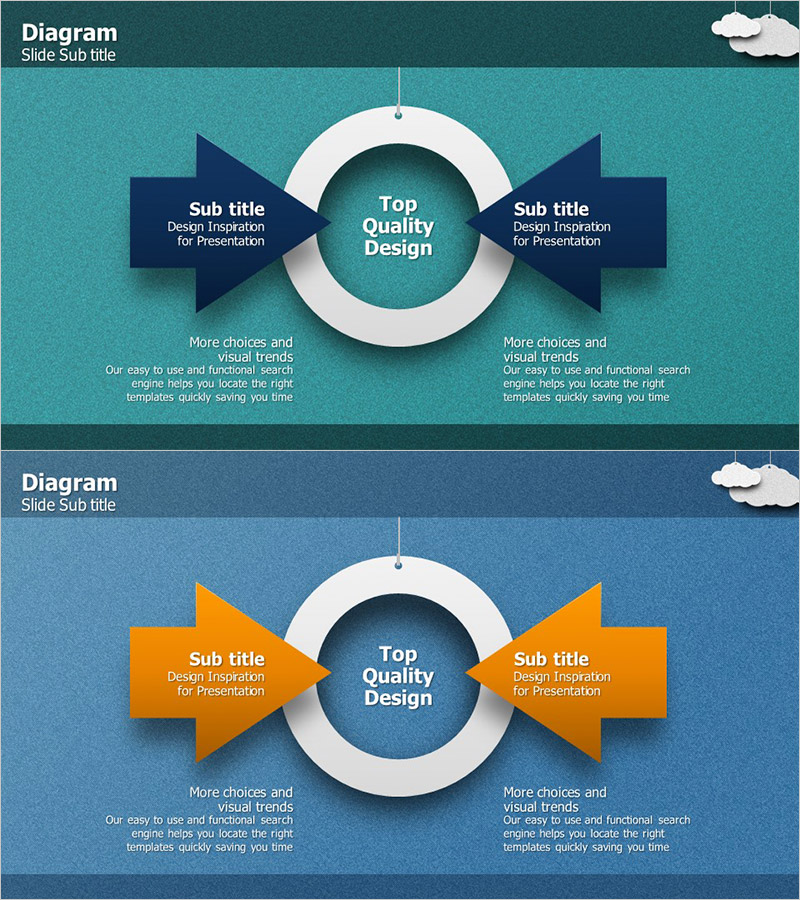
A bidirectional arrow diagram PowerPoint slide designed to visualize marketing strategy and target market analysis. The layout features a central circular focal point with symmetrical left and right arrows, each accompanied by text description areas below. Available in two color versions—teal and dark blue—allowing customization to match corporate branding. Provided in 16:9 widescreen PPTX format for immediate editing. Ideal for marketing planning presentations, business strategy pitches, and market analysis decks where emphasizing the interaction and balance between two strategic elements is essential.
Usage Points
-
Main Usage
Visually represents the interaction and balance between two strategic elements in marketing (competitor vs. our company, current vs. target market, supply vs. demand). The central circular focal point emphasizes integration and harmony, while bidirectional arrows symbolize two-way communication and strategic alignment.
-
How to Use
Use in the market analysis section of marketing plans, competitive analysis slides in business strategy presentations, and product launch strategy decks. Input specific strategic elements in the text areas below each arrow to enhance audience comprehension and engagement.
-
Recommended For
Marketing managers, business strategy planners, sales directors, and market analysts presenting to executives, investors, and partners. Particularly effective for new market entry strategies, competitive positioning, and customer segmentation presentations.
-
Slide Structure
Two-slide set. Each slide features a central circular focal point with two symmetrical bidirectional arrows (left and right). Each arrow is accompanied by subtitle and description text input areas (2 per arrow). Header area for slide title and footer space for additional explanatory text. Total of 6–8 text input areas per slide for comprehensive information layout.
Related Products
-

Business Forest Wide Template Diagram2 – Flowchart for Market Strategy
#Marketing Plan and Strategy #Diagram #Target Market Strategy
-

Facility Orientation Diagram – Clarifying Marketing Strategy
#Marketing Plan and Strategy #Diagram #Text Box
-

Presentation Slide for Differentiated Marketing Launch Strategy
#Business Vision and Strategy #Marketing Plan and Strategy #Diagram
-

Launch Strategy Overlay Linear Diagram - Visualizing Business Strategy
#Business Vision and Strategy #Marketing Plan and Strategy #Diagram
