Network Presentation Template – Sleek Business Design
B0100012
- Last Update 01/01/2025
- File Size 5.6MB
- # of Slides 21
- File Format PPTX
- Slide Ratio 4:3
- Color
Slide Preview


Keywords
About the Product
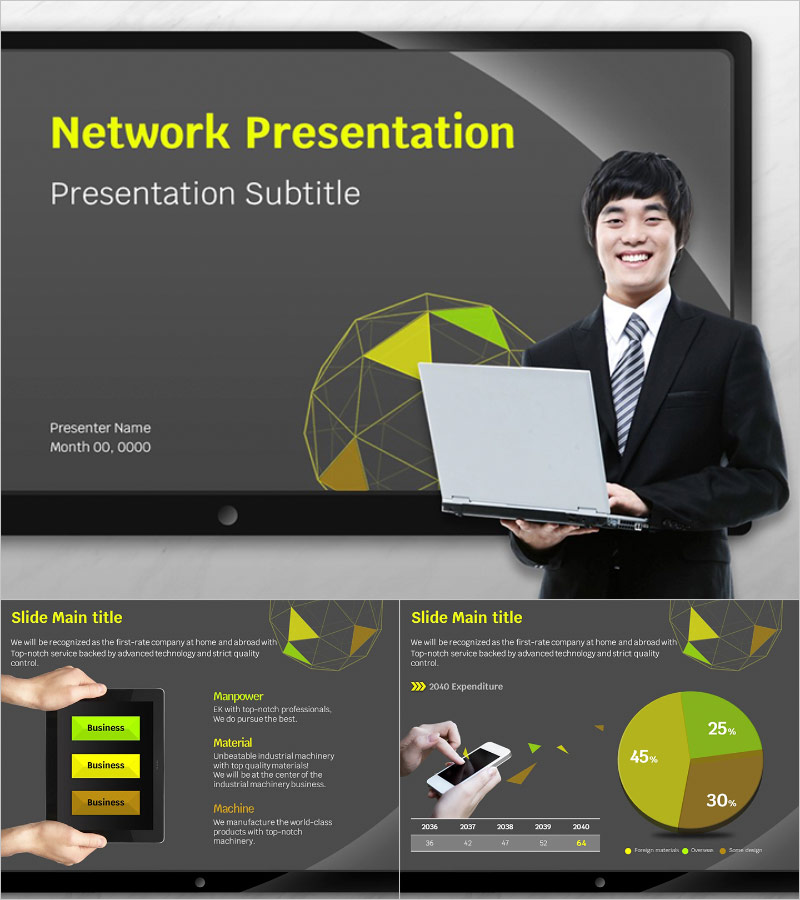
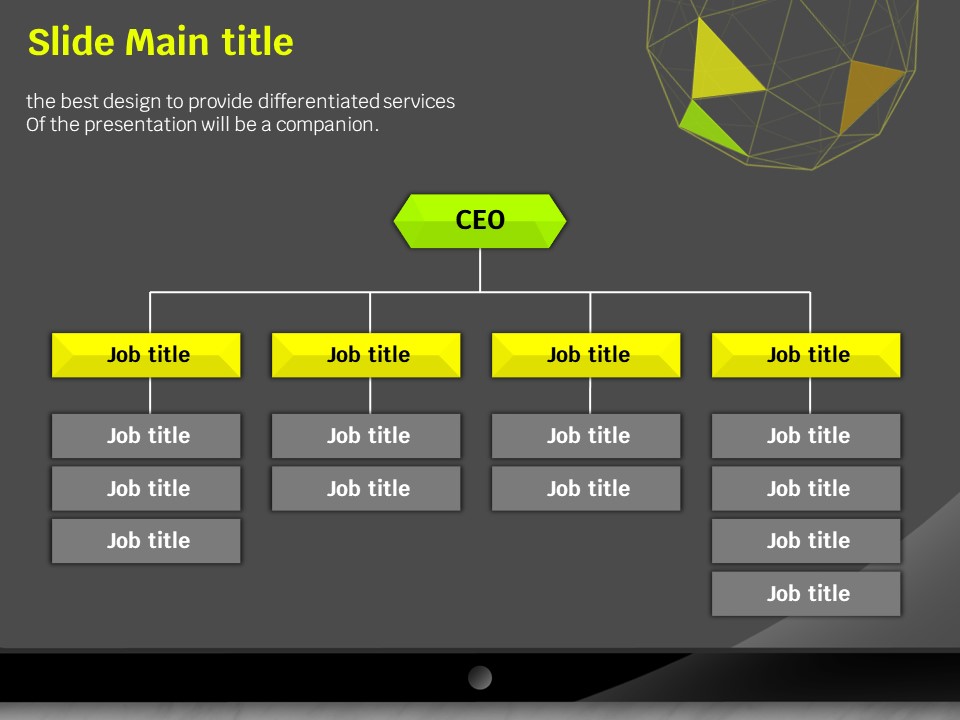
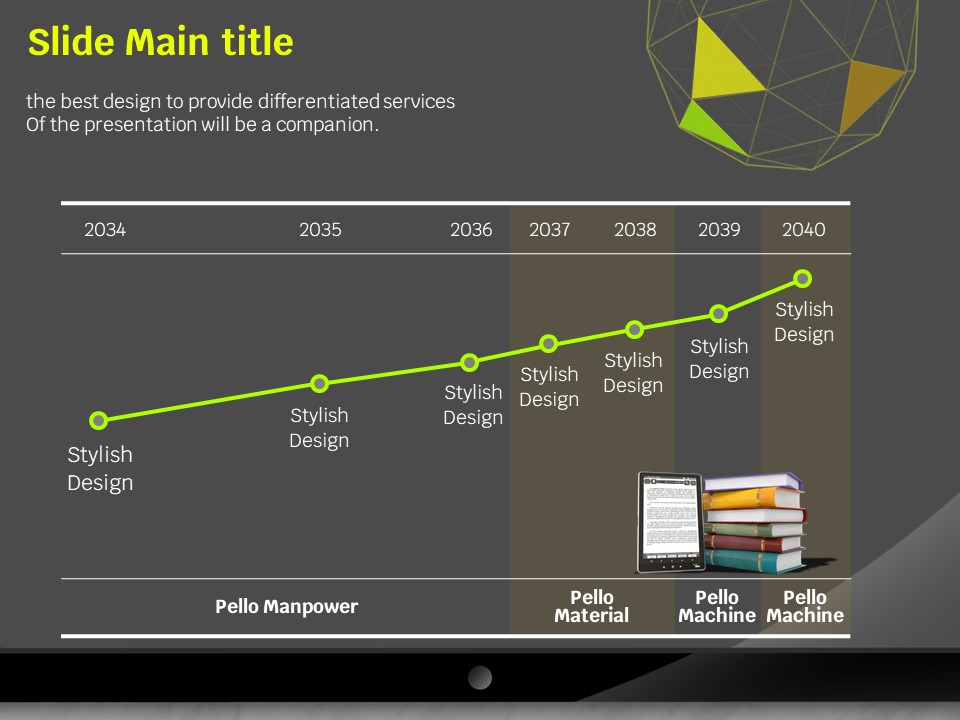
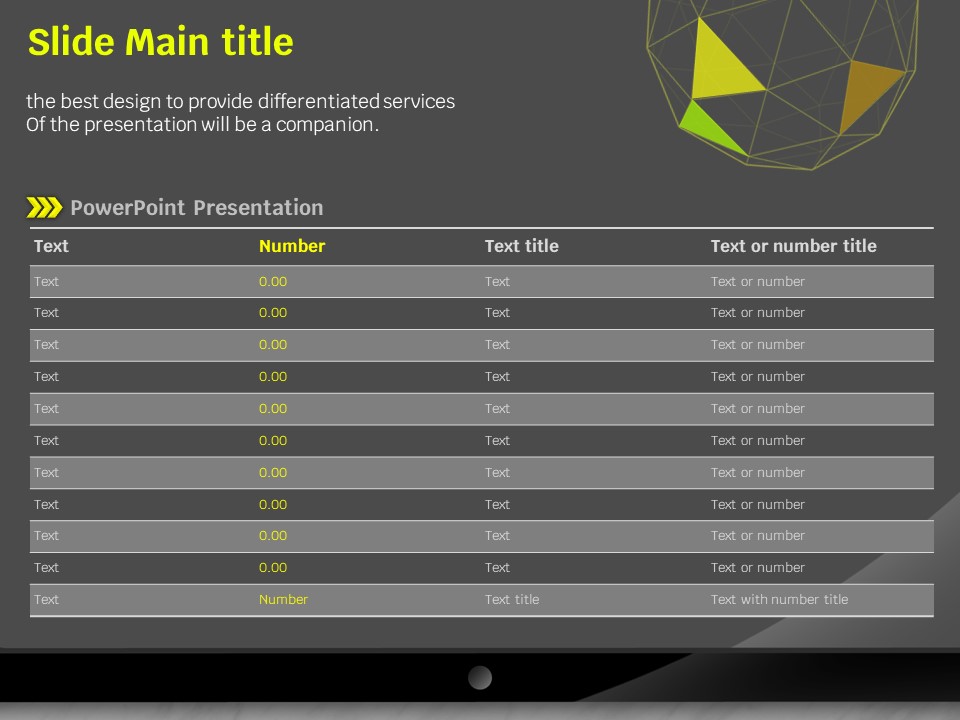
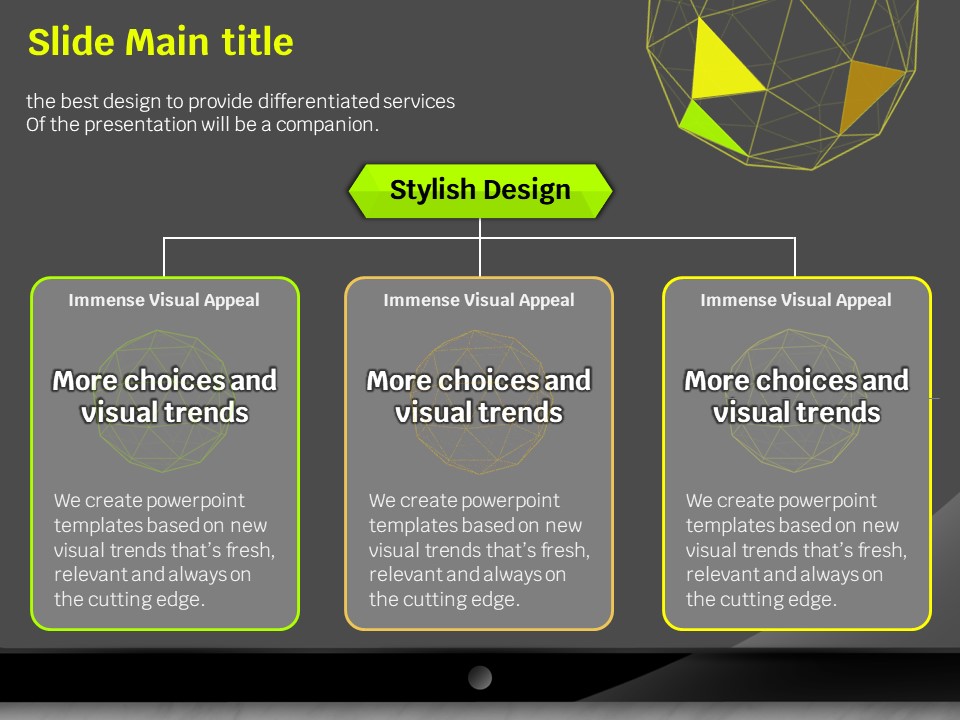
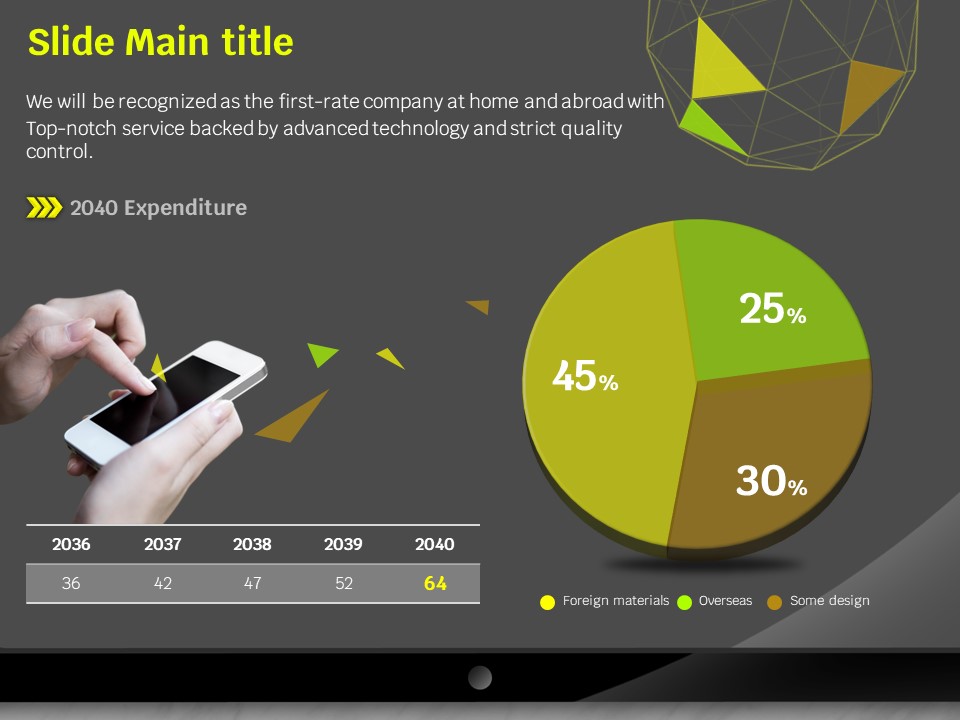
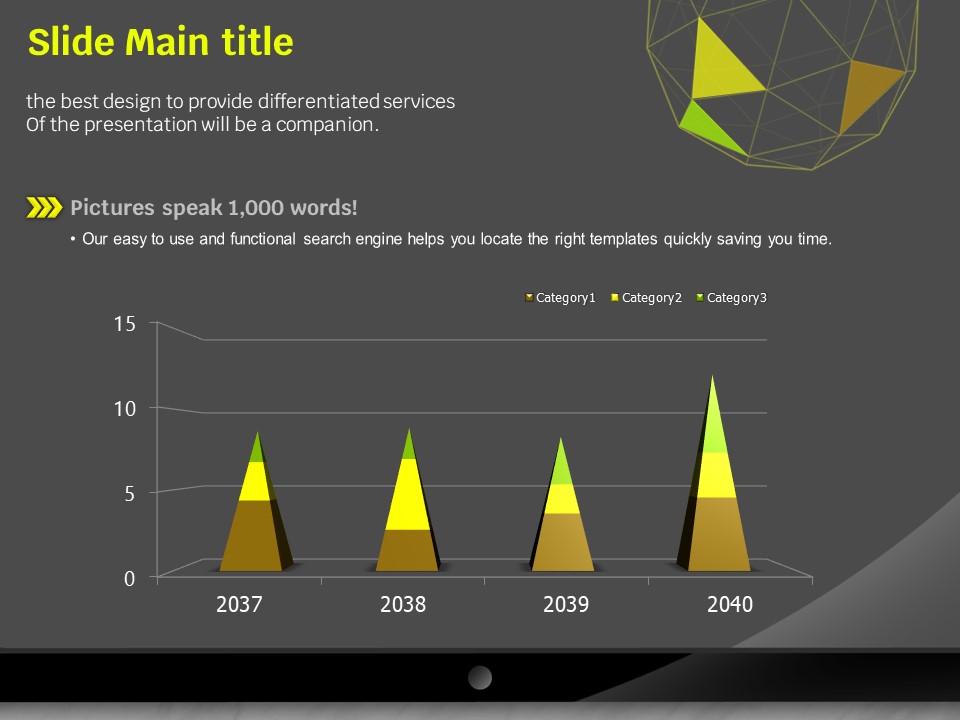
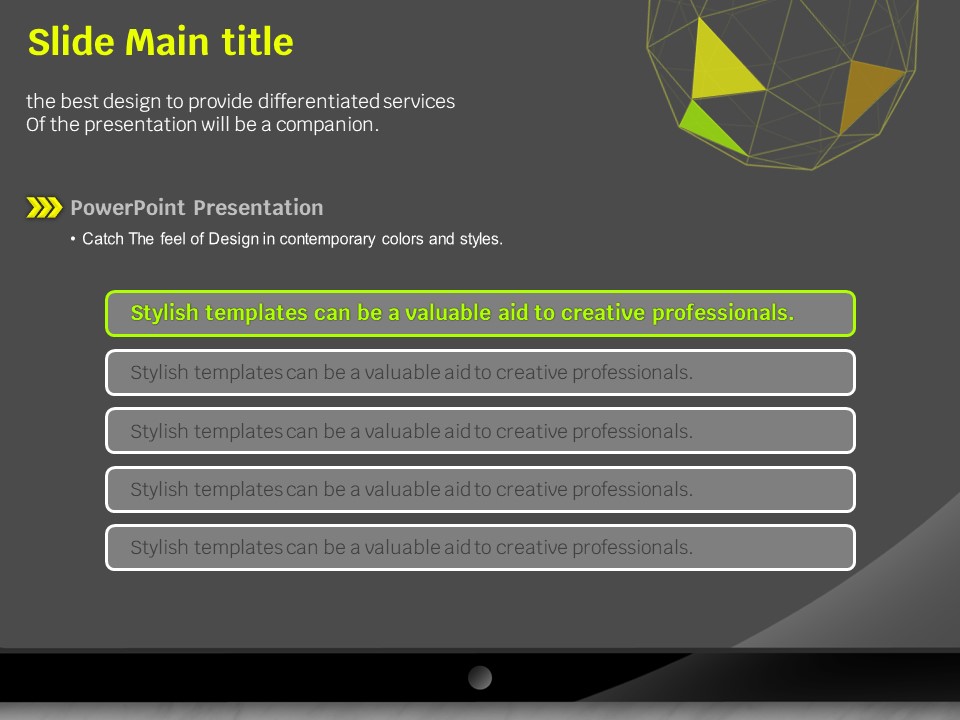
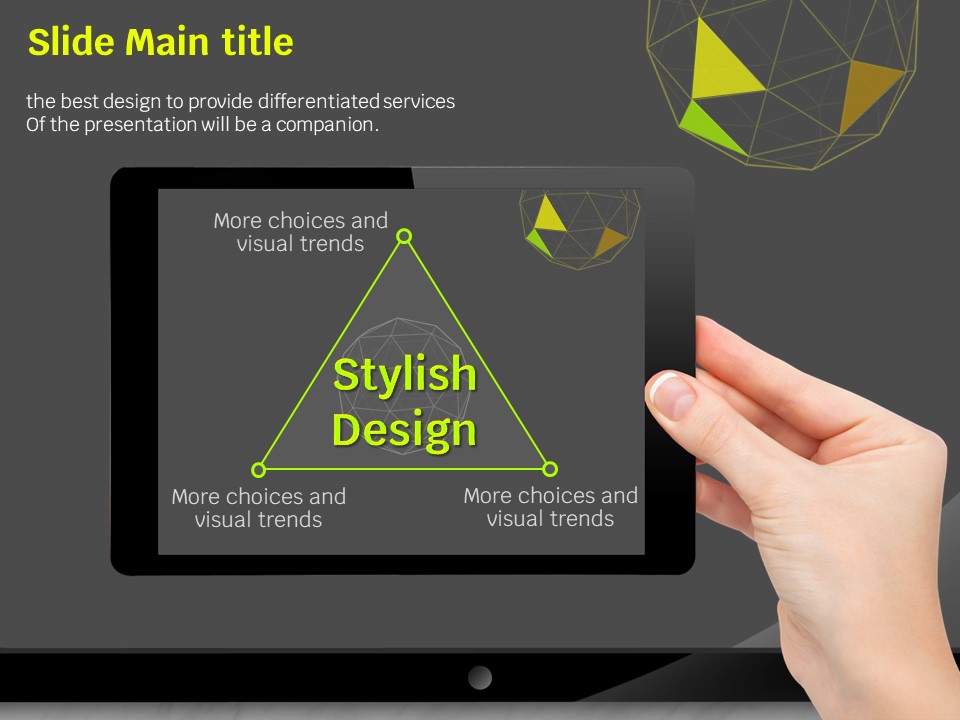
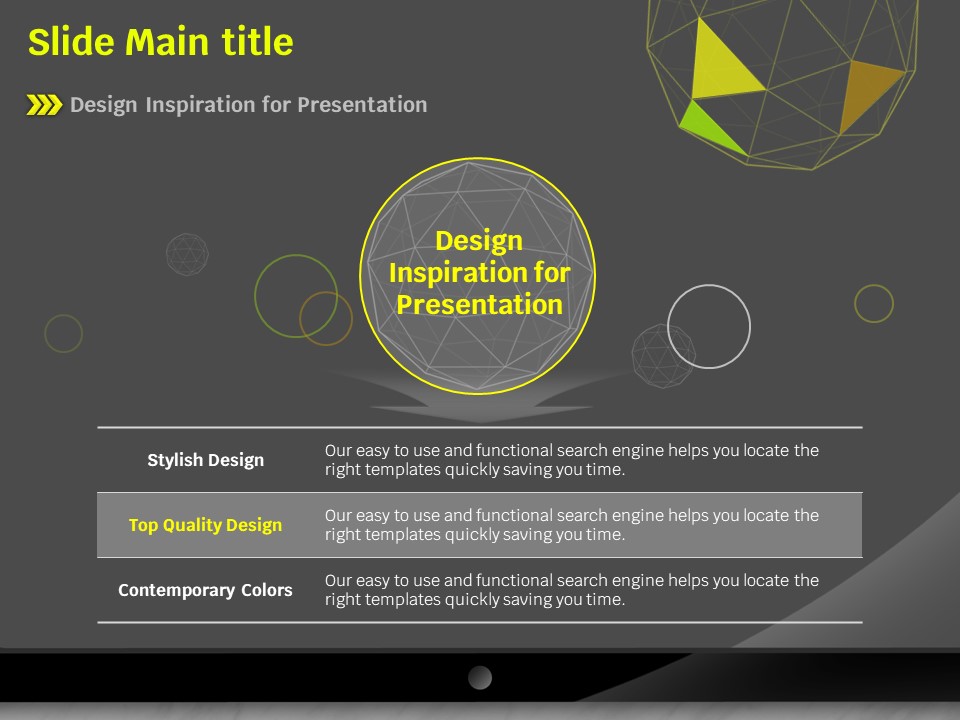
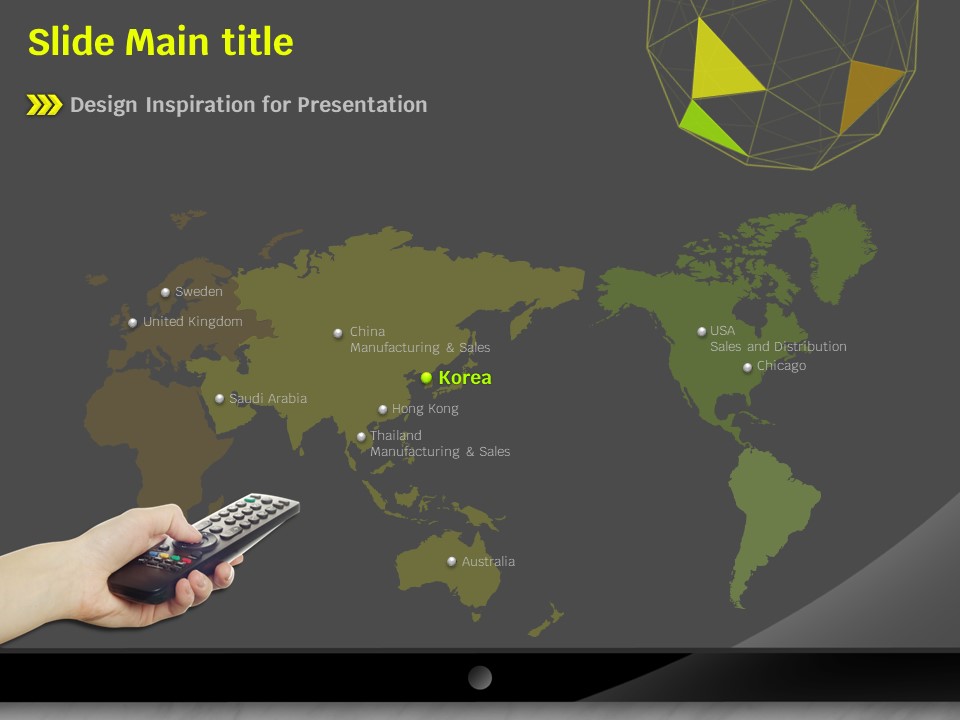
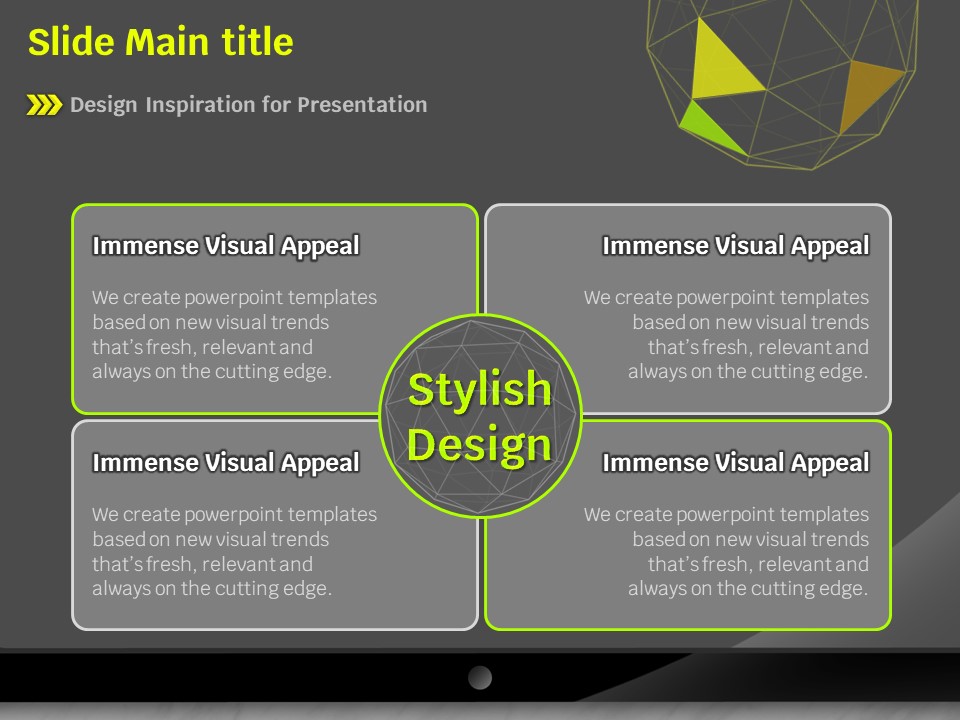
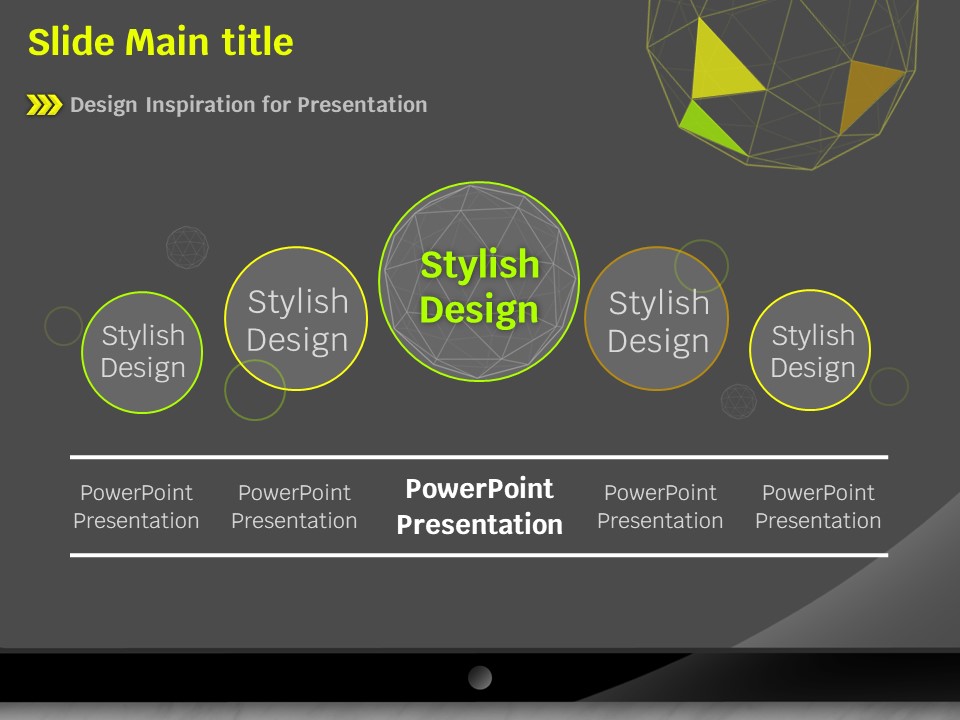
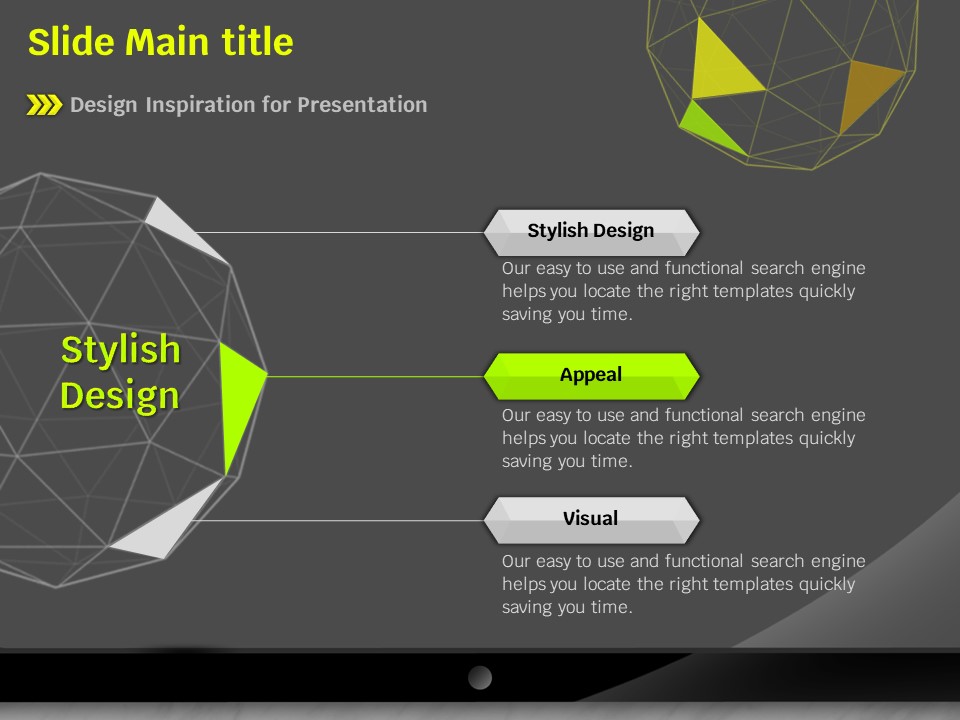
This IT and network business PowerPoint template features a charcoal gray background paired with lime yellow accent colors and geometric polygon motifs that convey both technical expertise and dynamic energy. The 21-slide deck includes a title slide with a presenter photo, three-column text layouts, a pie chart with percentage breakdowns, a year-by-year data table spanning 2036 to 2040, and a 3D pyramid bar chart for multi-category comparisons. Delivered in 4:3 ratio PPTX format, all text, colors, and chart data are fully editable so you can adapt the presentation to your specific content in minutes. Whether you are pitching a network service, reporting business performance, or presenting to partners and investors, this slide set provides a professional and data-driven visual framework. The dark-toned design with bold lime highlights ensures your key figures and messages stand out clearly on screen.
Usage Points
-
Main Usage
Designed for IT and network service companies to present service overviews, business performance reports, and partnership proposals in a professional, data-driven format.
-
How to Use
Open the PPTX file, replace the presenter name and date on the cover slide, update the body text and chart figures with your actual data, and the presentation is ready to deliver immediately.
-
Recommended For
Sales and planning professionals at IT or network firms, team leads and executives who need to visualize business metrics, and anyone preparing investor or partner-facing presentations.
-
Slide Structure
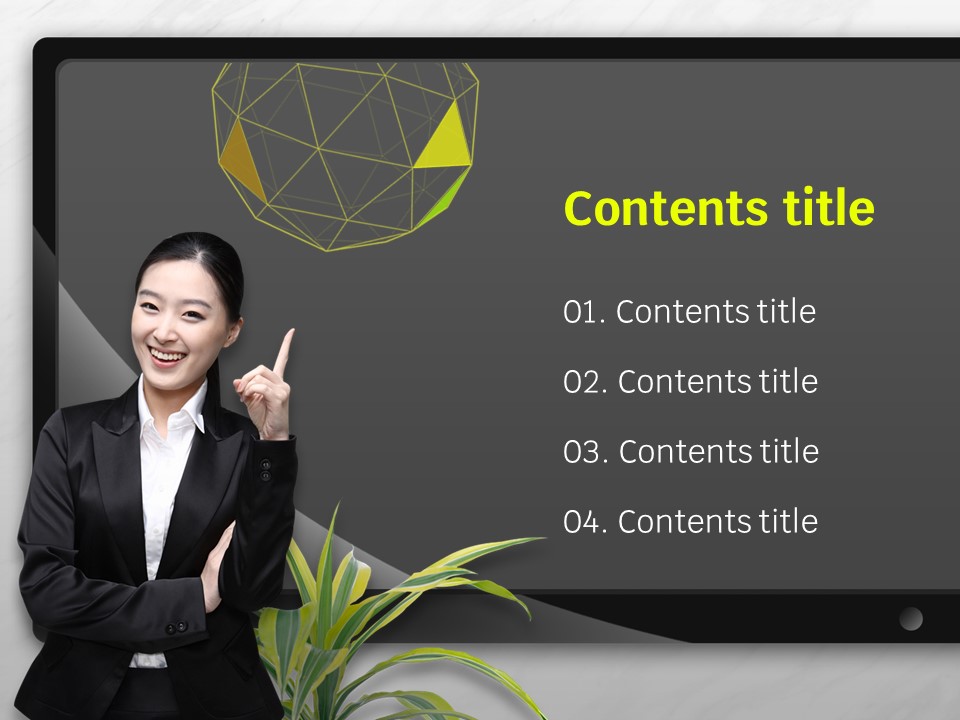
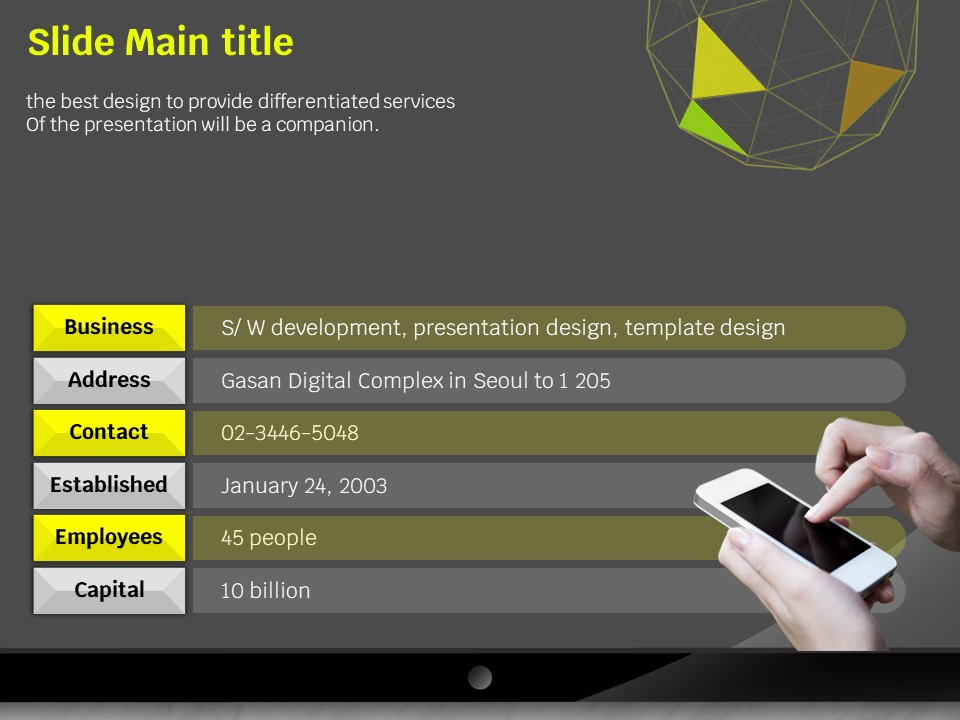
The 21-slide set includes a cover with presenter photo and polygon graphic, three-column text slides (Manpower, Material, Machine), a pie chart slide with 25/30/45% breakdown and a 2036–2040 data table, and a 3D pyramid bar chart comparing three categories across four years.
Related Products
-

Opinion PPT Wide – Stylish Design for Effective Presentations
#Business
-

Ideas Conference Presentation Template – Stylish Business Design
#Business
-

Multitasking Presentation Template – Optimized Design for Business
#Business
-

Entertainment Company Presentation Template – Stylish and Colorful Design
#Business
