Market Analysis Presentation Template Visualized with Newspaper Diagram
RJ0200046_21
- Last Update 04/11/2025
- File Size 0.7MB
- # of Slides 2
- File Format PPTX
- Slide Ratio 16:9
- Color
Keywords
- #Content-Based Slides
- #Design-Based Slides
- #Market and Competitor Analysis
- #Marketing Plan and Strategy
- #Diagram
- #Other
- #Target Market
- #Target Setting
- #Cluster
- #Inclusive Cluster Diagram
- #Map
- #16:9
- #world map PowerPoint slide
- #bubble diagram presentation
- #regional data visualization
- #geographic data chart
- #global market analysis PPT
About the Product
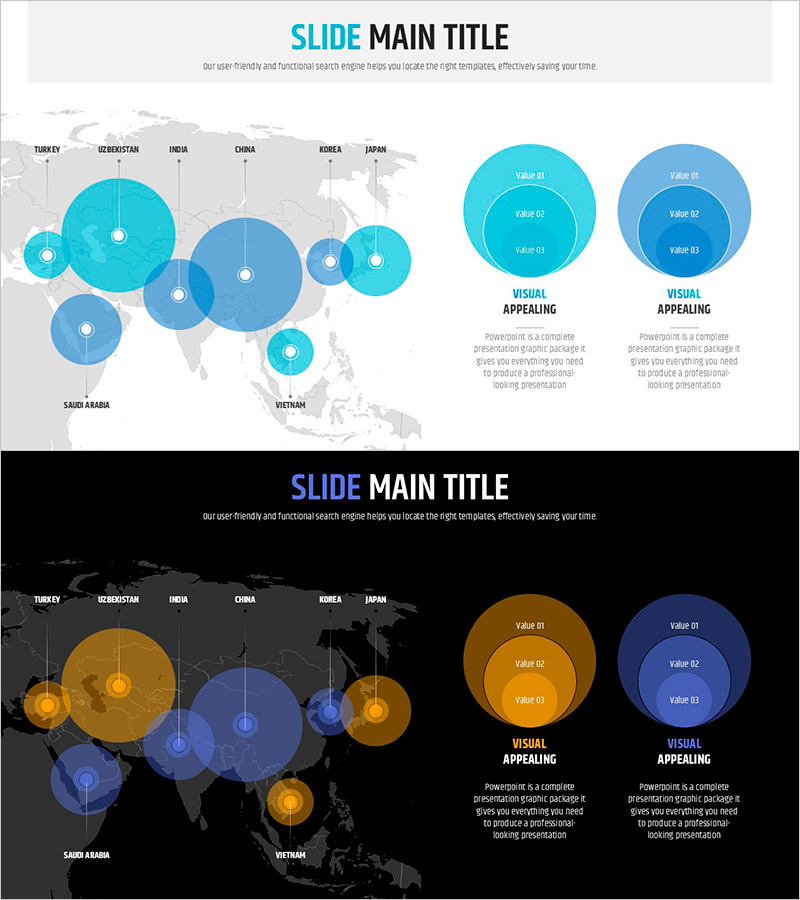
A PowerPoint slide set that visualizes regional data using bubble diagrams overlaid on a world map. Circles of varying sizes are positioned across key regions including Turkey, Uzbekistan, India, China, Korea, Japan, Saudi Arabia, and Vietnam to intuitively represent market size, sales volume, customer distribution, and other metrics. Two color schemes are provided: a light tone with cyan-to-blue gradient and a dark tone with orange-to-navy gradient, each with editable value fields in every bubble. Delivered in 16:9 widescreen PPTX format with 2 slides, ready for immediate customization.
Usage Points
-
Main Usage
Visualize and compare market size, sales performance, customer distribution, and business expansion status across major global regions using an interactive bubble diagram on a world map. Ideal for international business presentations, global marketing strategy reports, and regional performance analysis.
-
How to Use
Each bubble (circular node) positioned on a region represents data magnitude through size and color. Enter numerical values or labels in the text input area within each bubble, and adjust bubble size as needed to reflect relative proportions. Choose between light or dark background styles depending on your presentation environment and venue lighting.
-
Recommended For
Executives developing global business strategies, international marketing managers presenting regional sales performance, sales teams reporting geographic results, business development professionals pitching overseas expansion plans, and consultants visualizing multinational project status.
-
Slide Structure
2-slide set. Slide 1: Light-tone world map (cyan-to-blue gradient) with 8 regional bubbles and 2 circular chart areas on the right. Slide 2: Dark-tone world map (orange-to-navy gradient) with identical layout, each bubble includes editable value input fields.
Related Products
-

Recommendation of Honeymoon Destinations – Romantic Spots Around the World
#Market and Competitor Analysis #Marketing Plan and Strategy #Diagram
-

Infectious Treatment Map – Market Analysis and Strategy Presentation
#Market and Competitor Analysis #Marketing Plan and Strategy #Other
-

Market Target Setting and Analysis Map – Designing Effective Marketing Strategies
#Market and Competitor Analysis #Marketing Plan and Strategy #Other
-

Reasons for Selecting a Target Area – Marketing Strategy Outline
#Market and Competitor Analysis #Marketing Plan and Strategy #Other
