Orange Hexagon Presentation Template Icons & Text Box - Innovative Cluster Design
RJ0200038_23
- Last Update 04/08/2025
- File Size 0.8MB
- # of Slides 2
- File Format PPTX
- Slide Ratio 16:9
- Color
Keywords
- #Content-Based Slides
- #Design-Based Slides
- #Technical Approach
- #Diagram
- #Innovative Technologies and Future Plans
- #Cluster
- #Combination Diagram
- #16:9
- #overlapping diagram PowerPoint
- #circular cluster slide
- #icon diagram presentation
- #2-node relationship chart
- #cluster diagram PPT slide
- #orange diagram template
- #how to create overlapping diagram in PowerPoint
About the Product
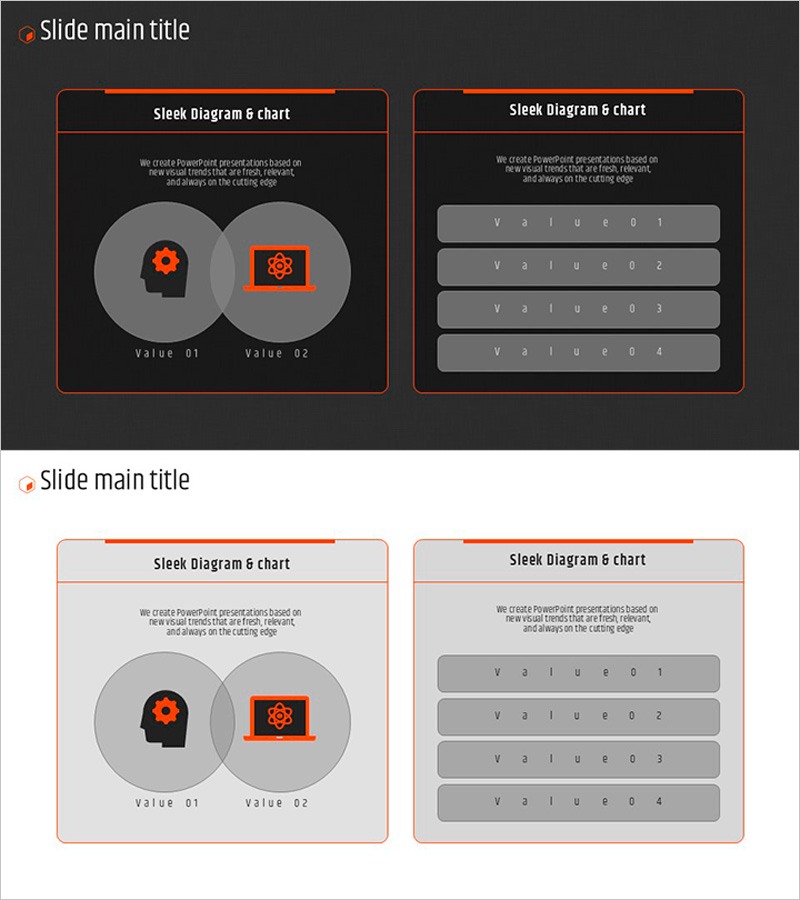
A cluster diagram PowerPoint slide featuring two overlapping circular nodes with icon placement at the center of each node. The design uses orange accent color against a gray background to create clear visual contrast and emphasize the relationship between core concepts. Each node includes a label area at the bottom for customizable text input. The second slide provides an alternative layout with four editable text box rows for data listing. Available in 16:9 aspect ratio PPTX format, ready for immediate editing. Ideal for explaining technological innovation, strategic relationships, interconnected concepts, and comparative analysis in business presentations.
Usage Points
-
Main Usage
Optimized for visualizing interaction between two core concepts, departments, or technologies. The overlapping circular structure intuitively represents inclusion relationships or intersections, while icon usage enables immediate recognition of each element's nature and function.
-
How to Use
Replace the icons and labels in the left slide's circular nodes with your own content, or input detailed information into the four text box rows on the right slide. Choose between the two layouts based on your presentation flow and content requirements.
-
Recommended For
Recommended for technology planning, business strategy, organizational structure explanation, product feature comparison, and system architecture introduction. Suitable for startup pitches, technical seminars, executive reports, and cross-functional team presentations.
-
Slide Structure
Slide 1: Two overlapping circular nodes with centered icons, bottom label areas, and descriptive text. Slide 2: Four editable text box rows for data input. Unified visual tone with orange accent color and gray background throughout.
Related Products
-

Carbon Neutral Marketing Strategy Circle Diagram – Innovation Technology and Business Support Strategy
#Operational Plan #Technical Approach #Diagram
-

IT Intra Service Overlay Diagram - Service Description and Connections
#Product/Service Introduction #Diagram #Features
-

Effectively Organized Fountain Pen Business Promotion Slide
#Product/Service Introduction #Business Management #Diagram
-

Business Area Circular Nesting Diagram – Cluster Visualization
#Company Introduction #Business Introduction #Diagram
