Premium Management PowerPoint Template: Map Analysis – Market and Competitor Analysis
RJ0200031_9
- Last Update 04/06/2025
- File Size 8.1MB
- # of Slides 2
- File Format PPTX
- Slide Ratio 16:9
- Color
Keywords
About the Product
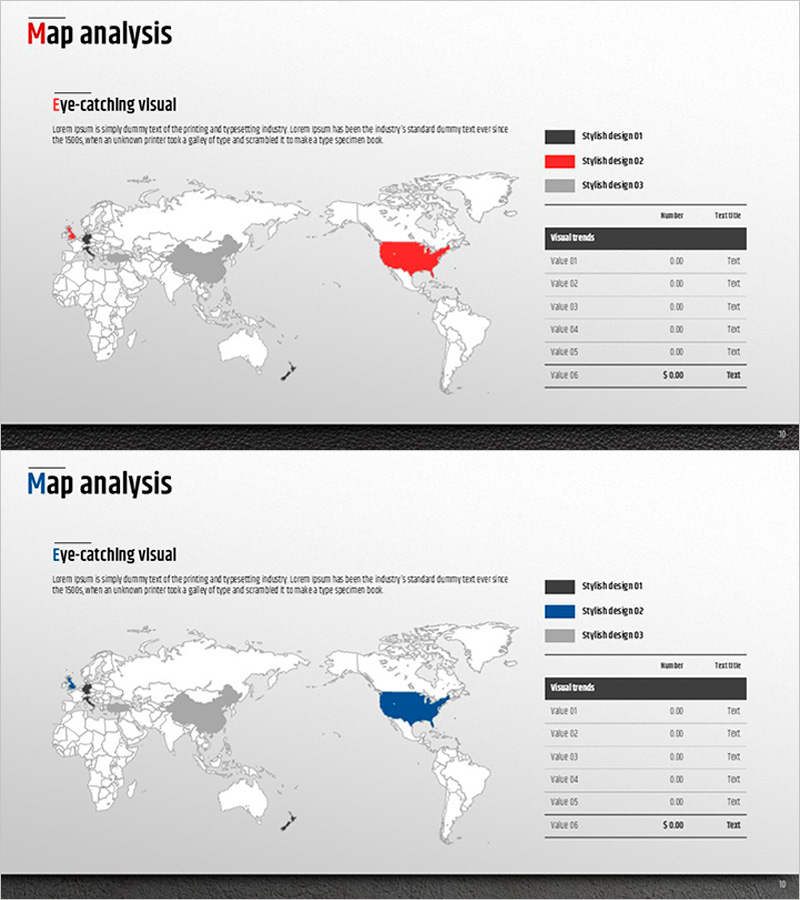
Essential geographic data visualization slides for market analysis and competitive research presentations. This PowerPoint slide deck displays regional market share, sales performance, and target markets on a world map using color-coded regions. The layout includes a legend and numerical data table for clear information hierarchy. Ideal for investor pitches, executive reports, and strategic planning sessions, these slides communicate global business performance and regional insights with credibility. The 16:9 widescreen format provides two fully editable slides ready for immediate use in corporate presentations.
Usage Points
-
Main Usage
Visualize global market distribution, regional sales performance, and target market locations using color-coded geographic regions and numerical data. Provides decision-making support by presenting regional business results and market opportunities to executives and investors in an intuitive format.
-
How to Use
Input regional data by color-coding each area on the world map and entering corresponding values in the legend and data table. Structure the first slide for overall market overview and the second for detailed regional analysis to strengthen narrative flow and strategic messaging.
-
Recommended For
Executive reports, investor relations presentations, marketing strategy sessions, and business expansion planning. Particularly effective for global companies analyzing regional performance, entering new markets, and comparing competitor market share across geographic regions.
-
Slide Structure
Two-slide layout with each slide containing a world map (1 text input area), three-tier color legend (3 categories), and data table (6 rows × 3 columns). Optimized for regional comparison analysis, simultaneously presenting numerical data and visual geographic information for comprehensive market insights.
Related Products
-

Global Map and Descriptive Text – Global Network Analysis
#Company Introduction #Market and Competitor Analysis #Other
-

Target Market Location Icon – Global Market Insights
#Market and Competitor Analysis #Marketing Plan and Strategy #Other
-

Slide Showing Target Market and Numbers
#Market and Competitor Analysis #Marketing Plan and Strategy #Other
-

Target Market VR Market Strategy – Effective Marketing Plan
#Market and Competitor Analysis #Marketing Plan and Strategy #Other
