Premium Management Presentation Triangular Diagram – Strategy and Vision
RJ0200031_17
- Last Update 04/06/2025
- File Size 7.6MB
- # of Slides 2
- File Format PPTX
- Slide Ratio 16:9
- Color
Keywords
About the Product
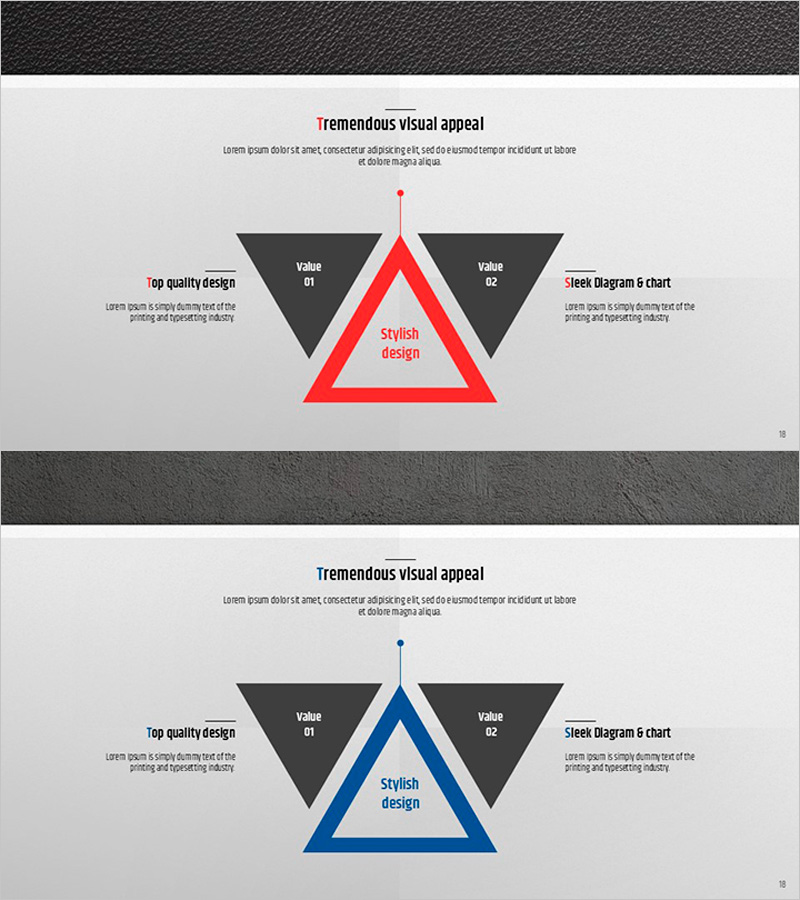
A triangular diagram PowerPoint slide designed to visualize business strategy and organizational vision. The layout features a central core value (Stylish design) flanked by two symmetrical value elements on either side, creating a balanced comparison structure ideal for strategic presentations. Available in two color versions—red and blue—against a light gray background, with fully editable text fields in each section. Perfect for executive briefings, marketing strategy presentations, and product positioning decks, this premium slide template enables clear communication of strategic priorities and competitive positioning.
Usage Points
-
Main Usage
Communicate organizational strategy and vision through a visually balanced triangular structure that highlights core values and strategic priorities. The symmetrical dual-element layout enables side-by-side comparison of strategic directions, making it ideal for presenting alternative approaches or complementary strategic pillars to stakeholders.
-
How to Use
Enter your core strategy name (e.g., Innovation, Growth, Differentiation) in the central triangle. Add strategic sub-elements in the left and right text boxes at the top. Complete the slide by detailing specific actions and expected outcomes in the lower gray sections on both sides.
-
Recommended For
Executive presentations, strategic planning sessions, marketing strategy workshops, product positioning pitches, organizational vision-sharing meetings, investor relations presentations, and competitive analysis briefings.
-
Slide Structure
Two-slide set featuring red and blue color variants. Each slide contains five editable zones: one central triangle, two upper text boxes (left and right), and two lower description areas (left and right), enabling multi-layered information presentation and strategic comparison.
Related Products
-

Setting Business Strategies by Sector - Unleashing Data
#Business Vision and Strategy #Marketing Plan and Strategy #Diagram
-

Blood Donation Marketing Strategy Diagram – Effective Data Visualization
#Business Vision and Strategy #Marketing Plan and Strategy #Diagram
-

Marketing Strategy Cycle Diagram – Effective Strategy Visualization
#Business Vision and Strategy #Marketing Plan and Strategy #Diagram
-

Mobile Service Business Step-by-Step Strategy – Efficient Future Design
#Business Vision and Strategy #Marketing Plan and Strategy #Diagram
