Five Color Infographic Template – Business Vision and Strategy
RJ0200009_23
- Last Update 03/30/2025
- File Size 4.5MB
- # of Slides 2
- File Format PPTX
- Slide Ratio 16:9
- Color
Keywords
- #Content-Based Slides
- #Business Introduction
- #Business Vision and Strategy
- #Business Areas
- #Core Competencies
- #16:9
- #core competency infographic PowerPoint
- #diamond shape slide design
- #5-color comparison layout slide
- #business strategy visualization PPT
- #how to create competency slides in PowerPoint
About the Product
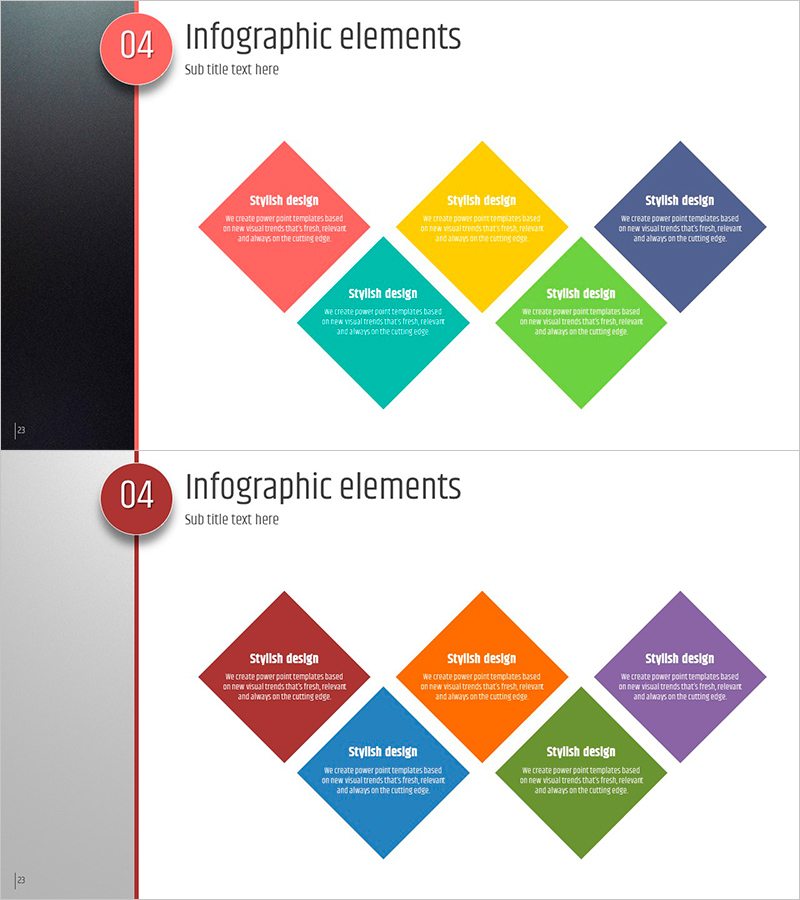
A PowerPoint slide that visualizes core competencies and business strategy using five colorful diamond shapes. The layout features a numbered badge at the top center and a vertical timeline line on the left, creating a clear information hierarchy. Each diamond area accommodates a title and descriptive text, with five distinct colors—red, yellow, blue, green, and teal—differentiating each item. Two slides are provided with different background colors (dark and light) to adjust the overall presentation tone. This infographic template is ready to use for business vision, strategy, and organizational capability presentations.
Usage Points
-
Main Usage
This slide effectively communicates core competencies, business strategies, and organizational strengths by categorizing them into five distinct elements. The color-coded diamond shapes emphasize each item's uniqueness while maintaining a cohesive overall message.
-
How to Use
Enter competency names or strategy items in each diamond area, then add detailed descriptions in the text fields below. The left timeline line can represent presentation sequence or priority levels. Select the background color that matches your presentation theme.
-
Recommended For
Ideal for executive presentations, investor pitches, strategic planning meetings, organizational restructuring explanations, and new business introductions. Works well in consulting reports, business plans, and company overview materials, particularly in strategy sections.
-
Slide Structure
The slide consists of a numbered badge (04) and title area at the top, a vertical timeline line on the left, and five diamond shapes in the center. Each diamond functions as an independent text box for title and description input, with automatic color differentiation in red, yellow, blue, green, and teal.
Related Products
-

8 Key Concepts for Visualizing Business Vision
#Business Introduction #Business Vision and Strategy #Diagram
-

Space Industry Core Competency Diagram – Future Strategy of Business
#Business Introduction #Business Vision and Strategy #Diagram
-

Medical Diffusion Diagram – Conveying Business Strategy and Vision
#Business Introduction #Business Vision and Strategy #Diagram
-

Core Competency Diagram – Emphasizing Business Strategy and Vision
#Business Introduction #Business Vision and Strategy #Diagram
