Triangle Pattern Wide Column Chart Presentation
RJ0200005_19
- Last Update 03/29/2025
- File Size 0.5MB
- # of Slides 2
- File Format PPTX
- Slide Ratio 16:9
- Color
Keywords
About the Product
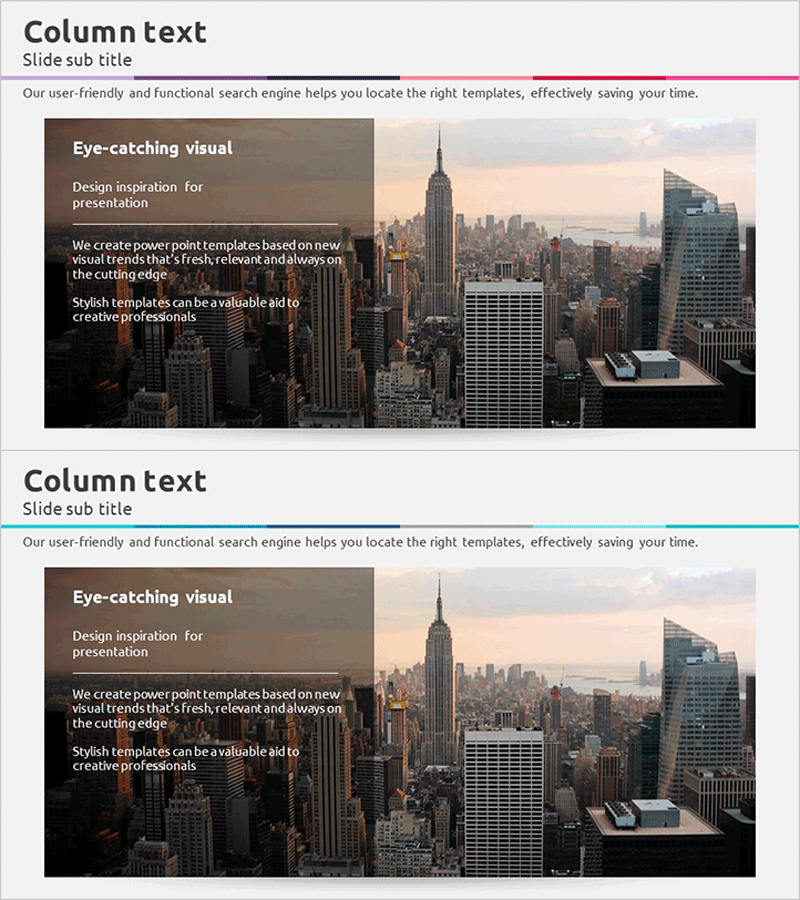
A professional 2-slide column chart PowerPoint template optimized for data comparison and analysis. The left side features a semi-transparent gray box containing title, subtitle, and descriptive text, while the right side displays a column chart overlaid on an urban cityscape background for visual impact. Designed in 16:9 widescreen format, this slide deck integrates seamlessly into modern presentation environments including analytical reports, marketing proposals, and business pitches. The clear separation between text input area and chart area ensures excellent readability, and color customization allows alignment with corporate branding guidelines.
Usage Points
-
Main Usage
Visualizes quantitative data through comparative column charts, enabling clear presentation of metrics such as revenue, performance indicators, and statistical findings. Ideal for investor pitches, executive briefings, and marketing analysis where data-driven communication is essential.
-
How to Use
Enter slide title, subtitle, and descriptive text in the left gray box. Replace chart data with your actual figures and adjust chart colors to match corporate guidelines. The urban background image can be retained or substituted with company-specific imagery. Font and color adjustments are fully customizable.
-
Recommended For
Recommended for financial analysts, market researchers, business development professionals, and marketing strategists. Particularly effective for quarterly earnings presentations, investor relations materials, executive reports, and consulting proposals requiring numerical evidence.
-
Slide Structure
Two-slide layout with each slide divided into left text area (title, subtitle, 3-4 lines of description) and right chart area (single column chart). The 16:9 widescreen format optimizes text-to-visual balance, and layered background imagery with chart overlay creates dimensional depth.
Related Products
-

Modern Interior Company Overview – Stylish Presentation
#Company Introduction #Text Box #Company Overview
-

Silhouette PPT Company Overview – Cluster Format Information Visualization
#Company Introduction #Diagram #Text Box
-

Snow Mountain and Square Box – Business Intro and Outro Slide
#Slide Type #Text Box #Intro
-

Future City Description Slides - Visualized with Cluster Structure
#Company Introduction #Diagram #Text Box
