Scientific Strategies for Service – Infographic Slide
RB0800034_6
- Last Update 03/25/2025
- File Size 1.4MB
- # of Slides 2
- File Format PPTX
- Slide Ratio 4:3
- Color
Keywords
- #Content-Based Slides
- #Design-Based Slides
- #Business Vision and Strategy
- #Diagram
- #Business Vision
- #Core Competencies
- #Spread
- #Centralized Diagram
- #4:3
- #radial diagram PowerPoint
- #central diagram slide template
- #hexagon diagram presentation
- #3-point diagram
- #strategy visualization slide
- #PowerPoint diagram template download
About the Product
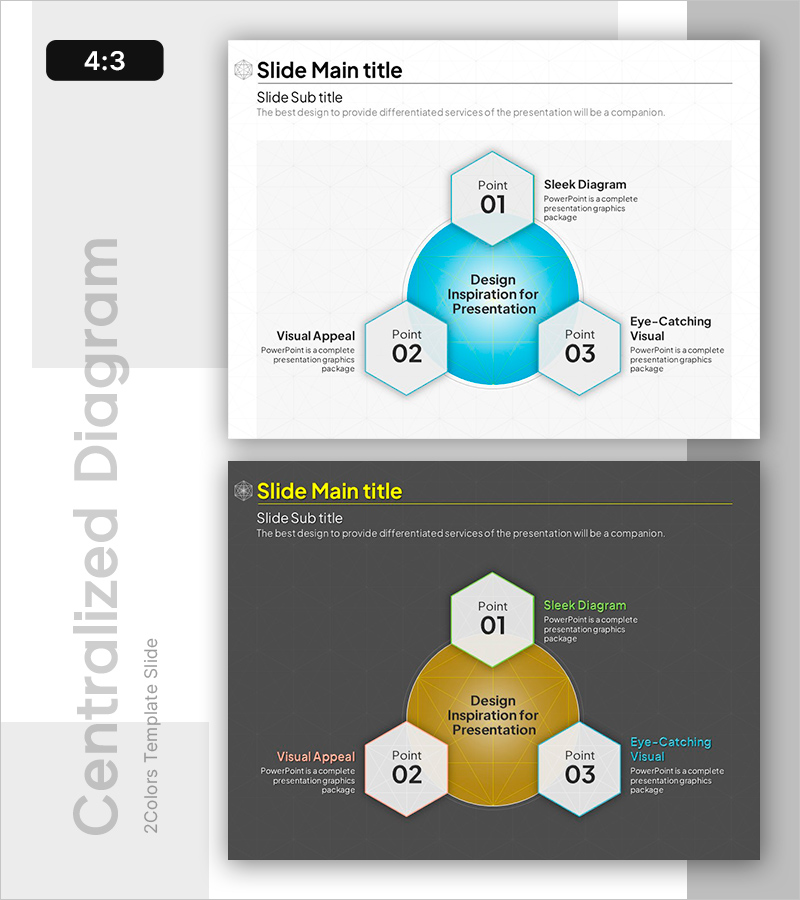
A central radial diagram PowerPoint slide featuring a blue gradient sphere at the core with three surrounding white hexagon nodes. This presentation template effectively visualizes hierarchical relationships between a core concept and three supporting elements, making it ideal for strategy presentations, vision statements, and capability frameworks. The 4:3 aspect ratio slide deck includes two fully editable layouts with customizable colors and text fields for immediate use in business presentations.
Usage Points
-
Main Usage
This diagram structure radiates three key elements from a central concept, making it perfect for presenting strategic frameworks, organizational capabilities, or service pillars. The central blue sphere anchors the primary message while the surrounding hexagons highlight supporting strategies or value propositions.
-
How to Use
Place your core concept or headline in the central blue sphere, then add three supporting points or strategic pillars in the surrounding hexagon nodes. Modify text, adjust colors to match your brand, and use the alternate dark-background version for visual variety across your presentation slides.
-
Recommended For
Executive presentations, business strategy decks, organizational restructuring announcements, product positioning pitches, marketing strategy proposals, and consulting presentations where clear hierarchy between core concepts and supporting elements is essential.
-
Slide Structure
Two-slide layout in 4:3 format. Slide 1 features a light background with a blue gradient central sphere and three white hexagon nodes arranged radially. Slide 2 presents the same diagram structure on a dark gray background with a gold-toned central sphere, providing color variation options for different presentation contexts.
Related Products
-

Blue Core Objectives Diagram – Business Vision and Strategy
#Business Vision and Strategy #Diagram #Business Vision
-

Advantages of Organic Skincare – Eco-Friendly Approach
#Business Vision and Strategy #Diagram #Business Strategy
-

Visual Diagram for Global Export Business Vision
#Business Vision and Strategy #Diagram #Business Vision
-

Summary of Key Business Elements Diagram – Delivering Strategic Value
#Business Vision and Strategy #Technical Approach #Diagram
