Stylish Design Slide for Presentations
RB0800029-1_21
- Last Update 03/24/2025
- File Size 0.4MB
- # of Slides 2
- File Format PPTX
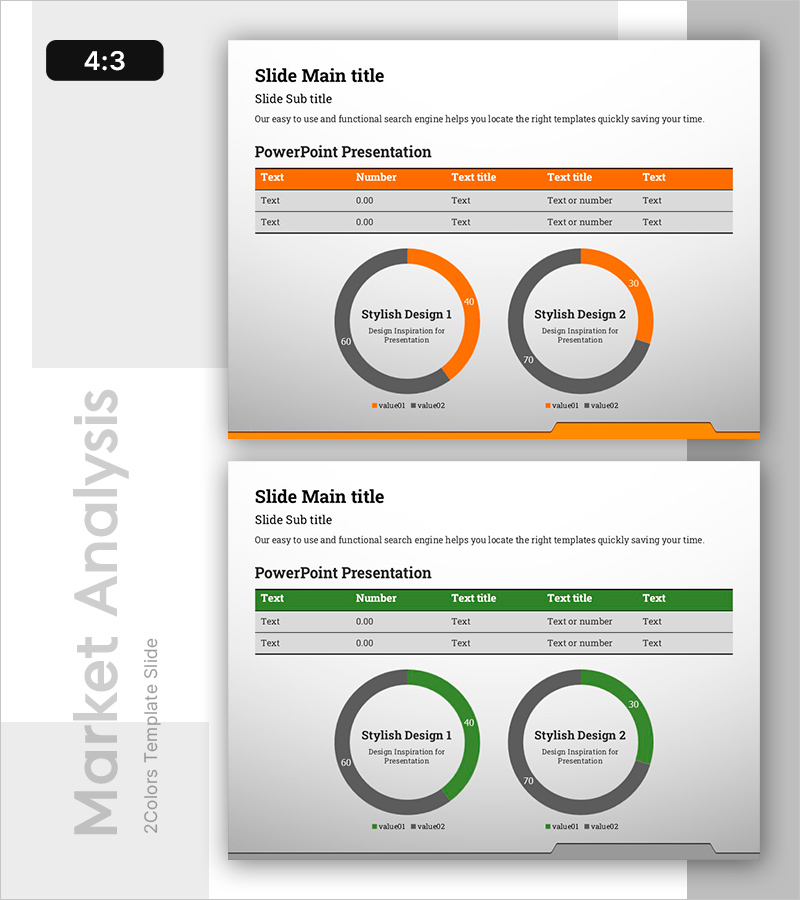
- Slide Ratio 4:3
Keywords
About the Product
A 2-slide PowerPoint set optimized for market analysis and data comparison presentations. Features orange and green dual-tone donut charts that visualize two metrics simultaneously, with a data table at the top and legend at the bottom for clear numerical information. Available in 4:3 ratio PPTX format, ready to insert into existing presentations with fully editable text and values. Ideal for market share analysis, SWOT comparisons, competitive benchmarking, and other analytical presentations requiring side-by-side data visualization.
Usage Points
-
Main Usage
Visualizes quantitative market data from two perspectives simultaneously, such as market conditions, competitive analysis, and market share comparisons. The donut chart center space accommodates key metrics or percentages for immediate comparative understanding.
-
How to Use
Input actual data (text, numbers, labels) into the top table, then modify donut chart values for automatic visualization. Use the legend to clarify each item's meaning. Colors in orange, green, and gray tones are easily customizable to match corporate branding.
-
Recommended For
Executive reports, investor presentations, marketing strategy meetings, and market research result sharing. Particularly valuable for finance, marketing, and strategy teams creating data-driven analysis materials and supporting management decision-making.
-
Slide Structure
Each slide contains title and subtitle areas, a 5-column data table with editable text and numerical fields, two donut charts comparing two values each, and a legend section. Optimized for 4:3 ratio with all text boxes and chart elements independently editable.
Related Products
-

Plastic Waste Emission PowerPoint Slide – Donut Chart
#Market and Competitor Analysis #Corporate Social Responsibility #Graph
-

Plogging Route Presentation Slide – 9-Point S-Curve Timeline
#Company Introduction #Business Strategy #Corporate Social Responsibility
-

Market Demand Analysis PowerPoint Slide – Donut Chart Layout
#Market and Competitor Analysis #Graph #Customer Analysis
-

Problem Definition PowerPoint Slide – 4-Step Flow Diagram
#Company Introduction #Business Strategy #Diagram
