Stylish Presentation with Comparison Diagram
RB0800028-1_21
- Last Update 03/23/2025
- File Size 0.3MB
- # of Slides 2
- File Format PPTX
- Slide Ratio 4:3
- Color
Keywords
- #Content-Based Slides
- #Design-Based Slides
- #Business Vision and Strategy
- #Diagram
- #Business Strategy
- #Business Background and Necessity
- #Cluster
- #Combination Diagram
- #4:3
- #Venn diagram PowerPoint
- #three-circle comparison slide
- #overlapping diagram template
- #intersection diagram PowerPoint
- #concept relationship chart
About the Product
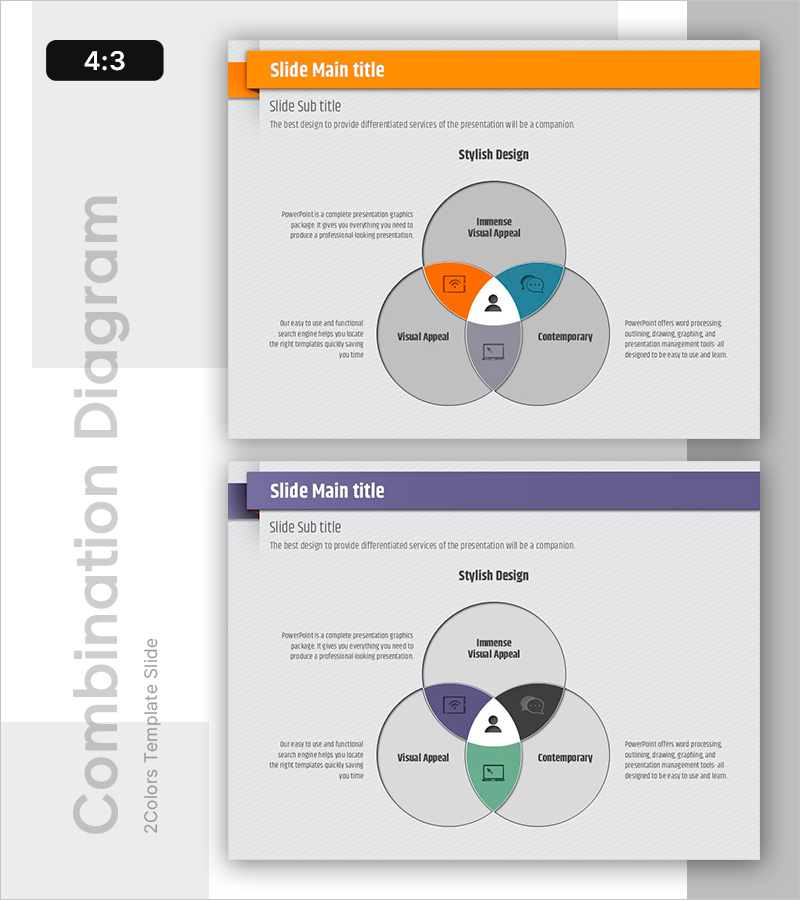
A PowerPoint slide featuring a three-circle overlapping Venn diagram with distinct color coding in orange, blue, and green. Each circular area includes text input fields to compare and analyze relationships between three concepts, services, or entities. The central intersection highlights shared attributes or common goals with an icon placeholder. This 4:3 ratio, 2-slide template enables clear visual communication of complex relationships and is ready for immediate use in presentations.
Usage Points
-
Main Usage
Compare and analyze three or more concepts, services, or organizational units simultaneously, highlighting both unique and shared characteristics. Use the intersection area to emphasize core value, common objectives, or integrated strategies for decision-making presentations.
-
How to Use
Enter comparison subjects (products, departments, strategies) in each circular area and insert common points in the central intersection. The color-coded regions provide visual clarity, and icons can be customized to match your industry or topic. Fully editable text and shapes for quick adaptation.
-
Recommended For
Executive reports, strategic planning meetings, product comparison analysis, organizational integration presentations, marketing positioning, and educational seminars where complex relationships must be communicated clearly and concisely.
-
Slide Structure
Three overlapping circles forming a Venn diagram with three text input areas per circle and one icon placeholder in the central intersection. Color-differentiated regions (orange, blue, green on slide 1; purple, black, teal on slide 2). Two-slide template with color variation options.
Related Products
-

Circular Connection Overlapping Diagram – Business Vision and Strategy
#Business Vision and Strategy #Diagram #Business Strategy
-

7P Marketing Overlay Diagram – Innovation in Business Strategy
#Business Vision and Strategy #Marketing Plan and Strategy #Diagram
-

Chromosome Theme Business Strategy Diagram
#Business Vision and Strategy #Marketing Plan and Strategy #Diagram
-

Colored Pencil Highlight Diagram – Implementation of Business Strategy
#Business Vision and Strategy #Diagram #Business Strategy
