Map Slide for Innovative R&D Center Locations
RB0800027_13
- Last Update 03/23/2025
- File Size 0.5MB
- # of Slides 2
- File Format PPTX
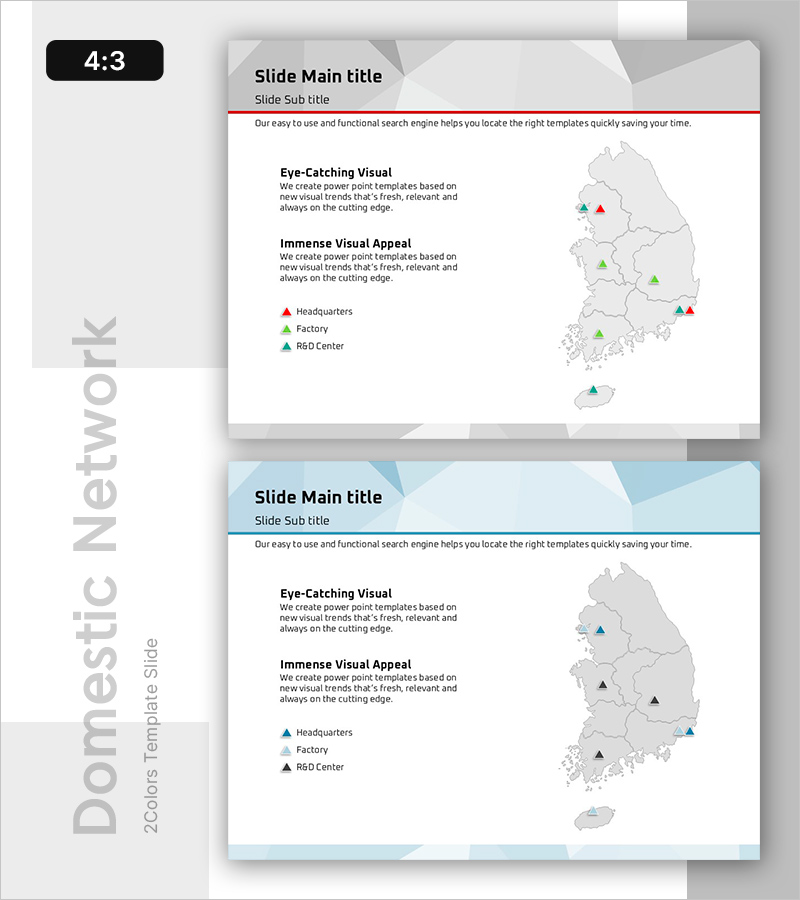
- Slide Ratio 4:3
Keywords
About the Product
A map-based PowerPoint slide that displays your company's global facilities and operations at a glance. The design uses color-coded icons to distinguish headquarters, factories, R&D centers, and other key locations across a geographic map. This 4:3 aspect ratio slide deck includes 2 slides combining descriptive text with visual mapping, ready for immediate editing in PPTX format. Perfect for investor presentations, partnership discussions, and corporate briefings where communicating your organization's global footprint and operational reach is essential.
Usage Points
-
Main Usage
Visualize your company's global presence by plotting headquarters, manufacturing plants, R&D centers, and regional offices on an interactive map. Communicate organizational scale and international reach to investors, partners, and employees with credibility and clarity.
-
How to Use
Open with the first slide to establish your company's vision and visual identity, then transition to the second slide to detail specific facility locations and operational categories. Use the color-coded legend to organize information hierarchically and guide audience understanding of your geographic distribution.
-
Recommended For
Ideal for company profiles, business plans, investor relations materials, and partnership proposals where demonstrating global infrastructure is critical. Recommended for multinational corporations, manufacturing firms, technology companies, and logistics organizations with geographically dispersed operations.
-
Slide Structure
Slide 1 features title, subtitle, and 3 descriptive text sections alongside a map area on the right. Slide 2 includes title, subtitle, 2 left-aligned text blocks for detailed explanation, and a map with legend on the right. Total of 2 content areas balancing text narrative with geographic visualization.
Related Products
-

Plogging Route Presentation Slide – 9-Point S-Curve Timeline
#Company Introduction #Business Strategy #Corporate Social Responsibility
-

Company Capabilities PowerPoint Slide – 3-Circle Icon Layout
#Company Introduction #Product/Service Introduction #Business Vision and Strategy
-

Project Overview PowerPoint Slide – 4-Spec Dark Real Estate
#Product/Service Introduction #Business Strategy #Diagram
-

Contact Closing PowerPoint Slide – Interior Dark Two-Column
#Company Introduction #Contact Information
