R&D Slide Visualizing Global Locations – Collaboration and Innovation
RB0800024_11
- Last Update 03/22/2025
- File Size 2MB
- # of Slides 2
- File Format PPTX
- Slide Ratio 4:3
Keywords
About the Product
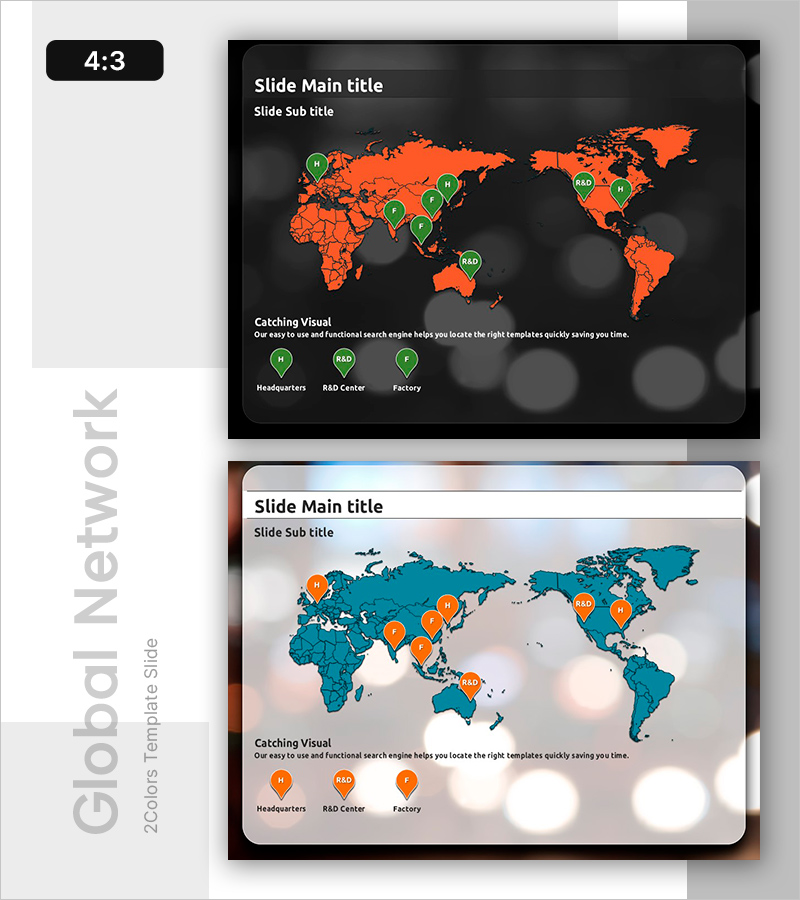
A professional PowerPoint slide visualizing global R&D centers, headquarters, and manufacturing facilities on a world map using green location pins. The dark background with orange map and clear icon differentiation enables instant comprehension of international collaboration structure. Featuring 2-slide variations with flexible layout options, this presentation slide is optimized for technology innovation and global strategy communications. Perfect for investor presentations, technical seminars, and corporate introductions to effectively showcase R&D capabilities and international network reach.
Usage Points
-
Main Usage
Visualize corporate R&D centers, research facilities, and production sites across the world map to demonstrate international collaboration systems and technology innovation capabilities. Provides stakeholders, investors, and partners with an intuitive understanding of global network scale and geographic distribution.
-
How to Use
Integrate into investor relations materials, technical presentations, and company profile documents within the technology capabilities section. Customize location pins and icons to match your actual organizational structure. The dark background ensures excellent readability in projector environments and digital presentations.
-
Recommended For
Technology-driven companies, manufacturing enterprises, biotech and pharmaceutical firms, IT corporations, executives, investor relations teams, and marketing professionals emphasizing global technical capabilities. Ideal for international collaboration projects, technology partnership presentations, and global expansion strategy discussions.
-
Slide Structure
2-slide set with first slide featuring dark background, orange world map, and 3 green pins (headquarters, R&D center, factory), second slide presenting teal map with orange pins on light background. Both slides include title, subtitle, descriptive text areas, and legend for comprehensive information architecture.
Related Products
-

F&B Menu PowerPoint Slide – Circular 4-Step Process Layout
#Operational Plan #Diagram #Business Processes
-

Problem Definition PowerPoint Slide – 4-Step Flow Diagram
#Company Introduction #Business Strategy #Diagram
-

Market Demand Analysis PowerPoint Slide – Donut Chart Layout
#Market and Competitor Analysis #Graph #Customer Analysis
-

Contact Closing PowerPoint Slide – Interior Dark Two-Column
#Company Introduction #Contact Information
