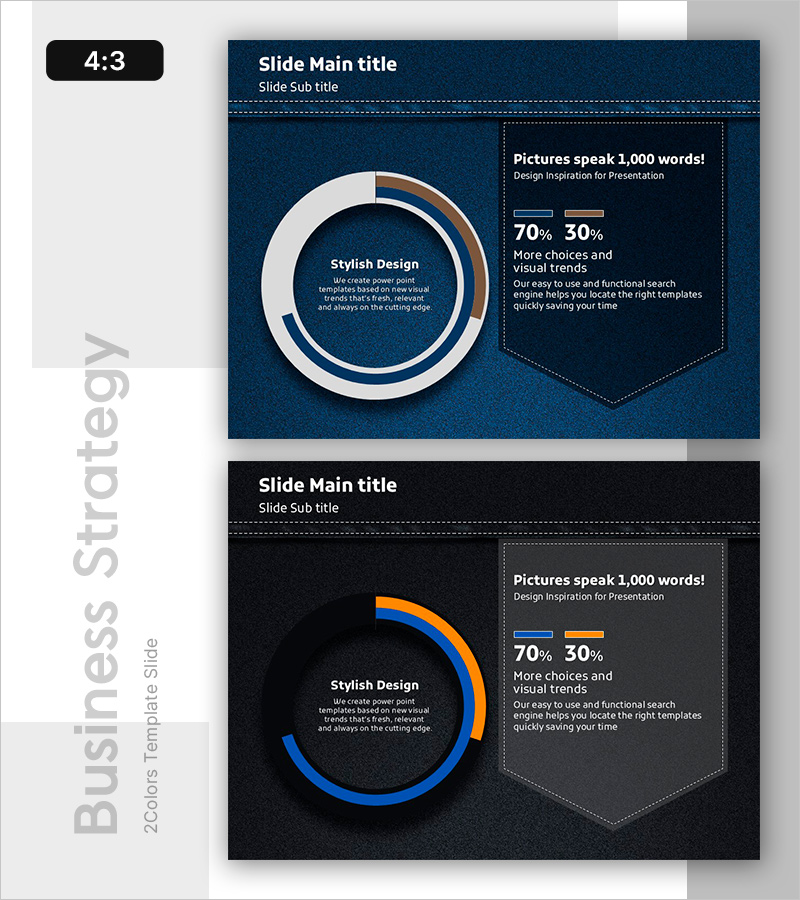
Pie Chart for Data Ratio Visualization – Stylish Design
RB0800023_9
- Last Update 03/22/2025
- File Size 7.4MB
- # of Slides 2
- File Format PPTX
- Slide Ratio 4:3
Keywords
About the Product
A PowerPoint slide template for visualizing data ratios using pie charts. Featuring a dark blue background with white and orange accent colors, this 2-slide PPTX deck combines a large pie chart on the left with a text box on the right for simultaneous data and explanation delivery. In 4:3 aspect ratio, it's ready for immediate editing and optimized for presenting market share, budget allocation, customer composition, and sales distribution. Perfect for reports, presentations, and business plans where data clarity is essential.
Usage Points
-
Main Usage
Presents market share, budget allocation, customer composition, and sales distribution data through intuitive pie charts. The left-side large diagram paired with right-side text box enables simultaneous display of numbers and insights, enhancing audience comprehension.
-
How to Use
Use in financial reports, marketing analysis, and business plans within the analysis section. Input percentages into pie chart segments and add interpretation or insights in the right text box. Colors and sizes are fully customizable to match your brand.
-
Recommended For
Finance teams, marketing departments, executive presentations, quarterly and annual reports, investor pitch decks, and business plan documents. Ideal for any presentation requiring data-driven analysis and decision support.
-
Slide Structure
2-slide layout with each slide featuring a large pie chart (3-4 segments) on the left and title, subtitle, and text description box on the right. Dark blue background with white borders and orange accents creates clear visual hierarchy, maximizing data readability.
Related Products
-

Plastic Waste Emission PowerPoint Slide – Donut Chart
#Market and Competitor Analysis #Corporate Social Responsibility #Graph
-

Problem Definition PowerPoint Slide – 4-Step Flow Diagram
#Company Introduction #Business Strategy #Diagram
-

Procurement Table PowerPoint Slide – Item Photo Budget Dark
#Product/Service Introduction #Financial Plans and Performance #Features
-

Sales Strategy PowerPoint Slide – 4-Framework Client Hub
#Product/Service Introduction #Business Vision and Strategy #Diagram
