Data Analysis Slide Using Vertical Bar Chart
RB0800021_9
- Last Update 03/22/2025
- File Size 0.9MB
- # of Slides 2
- File Format PPTX
- Slide Ratio 4:3
Keywords
About the Product
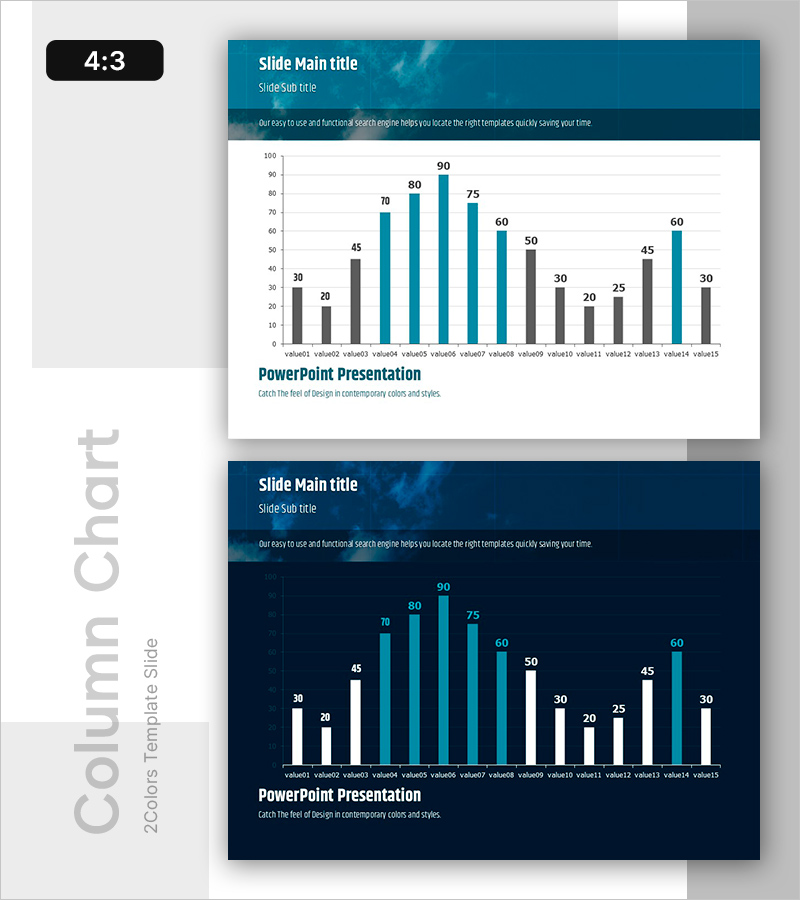
Essential vertical bar chart slide for market analysis, financial reporting, and performance presentations. The dark blue header and white background maximize data readability, while dual-color bars in gray and teal enable intuitive comparative analysis. Two-slide format allows you to use the same chart on both light and dark backgrounds, displaying 15 data points for at-a-glance comparison. Instantly applicable to PowerPoint presentations, quarterly performance analysis, and competitive benchmarking reports.
Usage Points
-
Main Usage
Clearly visualize numerical data such as quarterly revenue, market share, and performance comparisons. The dual-bar structure in gray and teal allows simultaneous comparison of two metrics, while data labels above each bar ensure precise value communication.
-
How to Use
Insert into the data section of financial reports, quarterly earnings presentations, or market analysis documents. Use the light background slide for printed materials and standard presentations; the dark background slide works best for online presentations and video recordings. Edit data values and legends to match your own statistics.
-
Recommended For
Ideal for finance teams presenting quarterly results, marketing teams reporting market analysis, executive decision-making meetings, and investor presentations. Particularly suited for executives, financial analysts, data analysts, and marketing strategists who rely on data-driven decision-making.
-
Slide Structure
Two-slide format with identical chart layouts in light background (top) and dark background (bottom). Each slide includes a title area, descriptive text section, and a vertical bar graph displaying 15 data points with clear legend and Y-axis scale indicators.
Related Products
-

Market Demand Analysis PowerPoint Slide – Donut Chart Layout
#Market and Competitor Analysis #Graph #Customer Analysis
-

Problem Definition PowerPoint Slide – 4-Step Flow Diagram
#Company Introduction #Business Strategy #Diagram
-

Plastic Waste Emission PowerPoint Slide – Donut Chart
#Market and Competitor Analysis #Corporate Social Responsibility #Graph
-

Customer Reviews PowerPoint Slide – Photo Grid Speech Bubble
#Customer Success Stories #Text Box #Customer Testimonials and Feedback
