3D Shape Template Schedule – Effective Time Management
RB0800019_19
- Last Update 03/21/2025
- File Size 2.5MB
- # of Slides 2
- File Format PPTX
- Slide Ratio 4:3
- Color
Keywords
About the Product
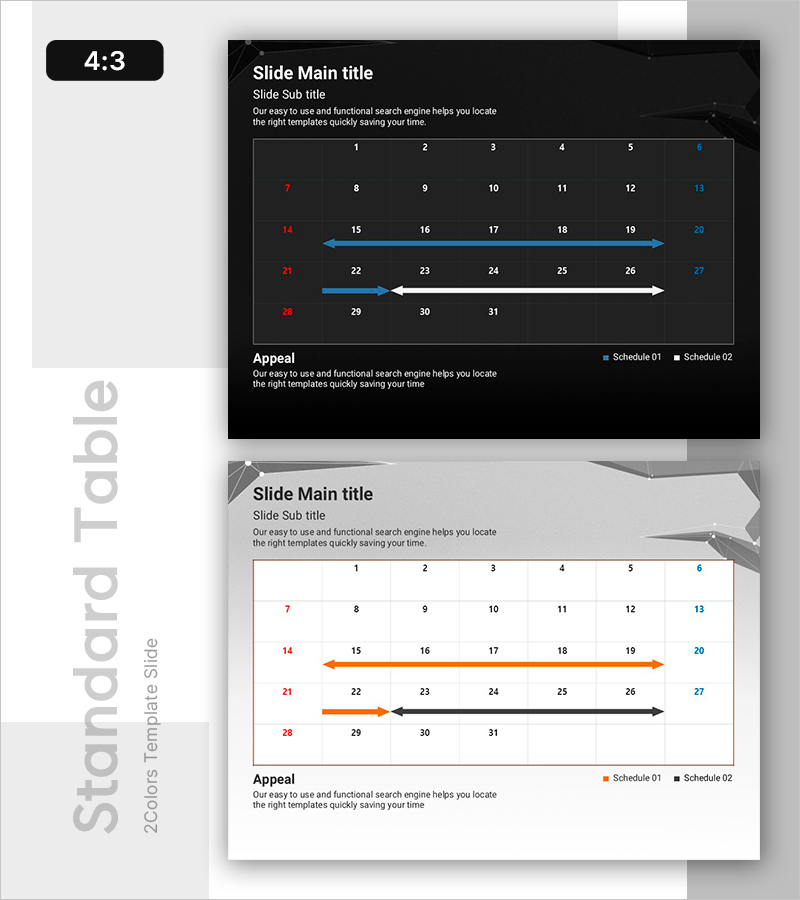
A directional arrow diagram PowerPoint slide designed to visualize project schedules and multi-stage progress tracking. The slide features blue and orange arrows representing four timeline stages, combined with a numbered grid layout to convey time flow intuitively. Provided in two versions—dark background and light background—allowing you to select the design that best fits your presentation environment. This editable PPT slide is ready to use in project timeline, milestone, and schedule planning sections of business presentations.
Usage Points
-
Main Usage
Clearly express project schedules, milestones, and phase-by-phase progress using arrow flow visualization. The combination of numbered grid and directional arrows simultaneously represents time axis and work stages, enhancing audience comprehension.
-
How to Use
Use in project planning presentations, business progress reports, marketing campaign timeline explanations, and schedule overviews. The dark background version suits formal, professional presentations, while the light background version works well for bright, positive-toned presentations.
-
Recommended For
Project managers, marketing professionals, business planners, and consultants who need to communicate schedules and progress updates. Applicable to business plans, proposals, reports, marketing strategies, and other corporate documents.
-
Slide Structure
Two-slide set: dark background version (blue and white arrows) and light background version (orange and black arrows). Each slide contains numbered grids (1–6 in 6 columns, 7–13 in 7 columns, 14–20 in 7 columns, 21–27 in 7 columns, 28–31 in 4 columns) with bidirectional arrows positioned in each row.
Related Products
-

Target Market Analysis Table
#Company Introduction #Market and Competitor Analysis #Diagram
-

Abstract Pattern Step Diagram – Business Strategy Visualization
#Business Strategy #Diagram #Step-by-Step Schedule Plan
-

Effects Analysis of Customized Exercise by Fitness Expert – Efficient Goal Achievement
#Product/Service Introduction #Technical Approach #Diagram
-

Key Step Planning Diagram – Blueprint for Business Operations
#Business Management #Operational Plan #Diagram
