Sleek Diagram for Modern Design Visualization – Contemporary Presentation
RB0800016_6
- Last Update 03/21/2025
- File Size 2.7MB
- # of Slides 2
- File Format PPTX
- Slide Ratio 4:3
Keywords
About the Product
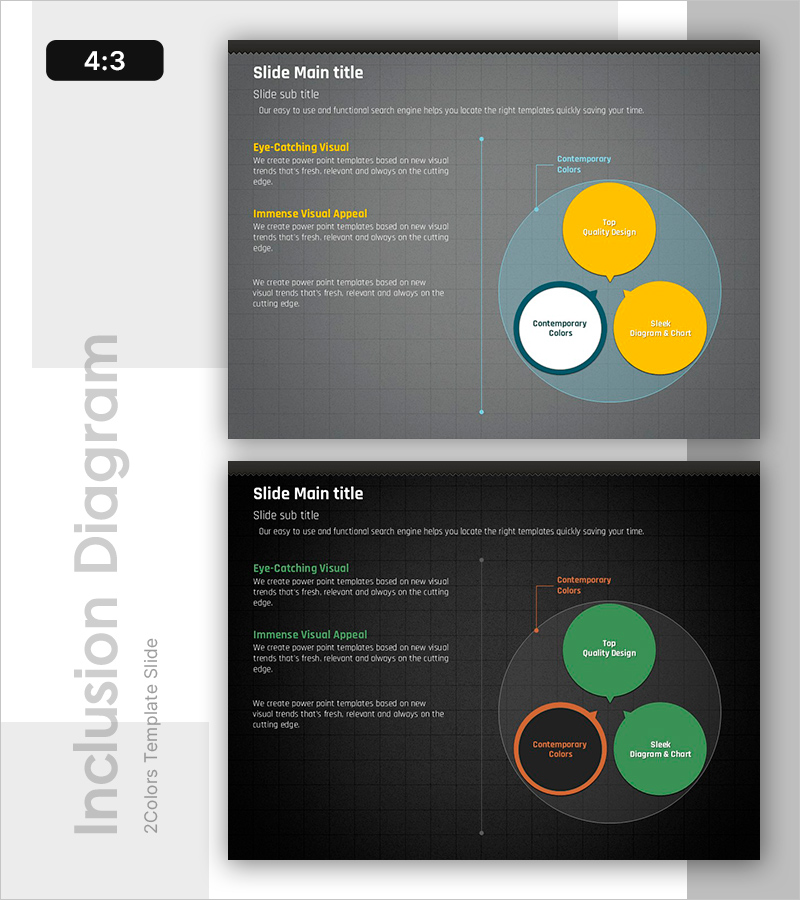
A comparative analysis PowerPoint slide that visualizes three elements as circular bubbles. Set against a dark gray background, the slide features yellow, blue, and green circular elements with editable title and description text in each bubble. The left section includes 'Eye-Catching Visual' and 'Immense Visual Appeal' areas to highlight key messages, while the right-side bubble diagram is ideal for comparing relationships and differences among three concepts at a glance. The 2-slide set provides color variations (yellow-green combination), available in 4:3 ratio PPTX format for immediate editing.
Usage Points
-
Main Usage
Visualize and compare three concepts, products, or strategies simultaneously while showing their relationships. Input titles, descriptions, and metrics into each bubble for SWOT analysis, competitor comparison, market positioning, core competency assessment, and other analytical presentations.
-
How to Use
Write analysis background and key points in the left text area, then input comparison subjects and characteristics into each bubble on the right diagram. Adjust bubble size, color, and position to represent importance or relationships. During presentation, explain each bubble sequentially to enhance audience comprehension.
-
Recommended For
Ideal for executives, planners, marketing teams, and strategy managers preparing decision-making materials. Suitable for business strategy development, market analysis, competitive strategy planning, product positioning, organizational capability evaluation, and any presentation requiring comparative analysis.
-
Slide Structure
Two-slide set with Slide 1 featuring yellow-blue bubble combination and Slide 2 with green-orange combination. Each slide comprises a left text area (title, subtitle, two sections) and right bubble diagram (three circles with center connector line), with all elements fully editable.
Related Products
-

Bispecific Antibody Platform Technology Slide – Dark 2-Color
#Product/Service Introduction #Operational Plan #Diagram
-

Brand vs. Competitor Messaging Slide – 3-Point, Blue & Green
#Product/Service Introduction #Market and Competitor Analysis #Benefits and Advantages
-

Product Roadmap PowerPoint Slide – Q1 to Q4 Launch Matrix
#Product/Service Introduction #Business Strategy #Development Plan
-

Team Mission & Org Structure PowerPoint Slide – Dark & Light
#Business Strategy #Business Management #Operational Plan
